Sales Analytics: Unveiling insights for Strategic Sales Optimization Using SQL & PowerBI
Business Request & User Stories
Request For Development of Toman Bike Share Dashboard
Dear Data Analyst
We need your expertise to develop a dashboard for”Toman Bike Share” that displays our key performance metrics for informed decision-making.
Requirements
* Hourly Revenue Analysis
* Profit & Revenue Trends
* Seasonal Revenue
* Rider Demographics
Design & Aesthetics: Use our company colors and ensure that the dashboard is easy to navigate.Data Source: Access to our databases will be provided if not create one.
Deadline: We need a preliminary version ASAP.
Please provide an estimated timeline for completion and recommendation on raising prices next year.
Best regards,
The expertise of a Marketing data analyst is requested to develop this dashboard, ensuring it meets the outlined requirements and aids in strategic decision-making for Toman Bike Share.
Objective:
To develop a comprehensive dashboard for Toman Bike Share that provides insights into key performance metrics, aiding in informed decision-making.
Key Metrics and Analysis:
-
Hourly Revenue Analysis: Track and display revenue generated on an hourly basis to identify peak hours and revenue patterns throughout the day.
-
Profit & Revenue Trends: Analyze and visualize trends in profit and revenue over various periods (daily, weekly, monthly) to understand overall financial performance.
-
Seasonal Revenue: Examine revenue fluctuations across different seasons to identify seasonal trends and their impact on business.
-
Rider Demographics: Provide detailed analysis of rider demographics, including age, gender, and other relevant factors, to understand the customer base better.
The project workflow is explained below;
1. Creating a Database
2. Developing SQL Queries
3. Connecting PowerBi to Database
4. Building a Dashboard in PowerBi
5. Answering the Analysis Question
1. Data Cleansing, Preparation & Transformation (SQL)
To create the necessary data model for doing analysis and fulfilling the business needs defined in the user stories the following tables were extracted using SQL.
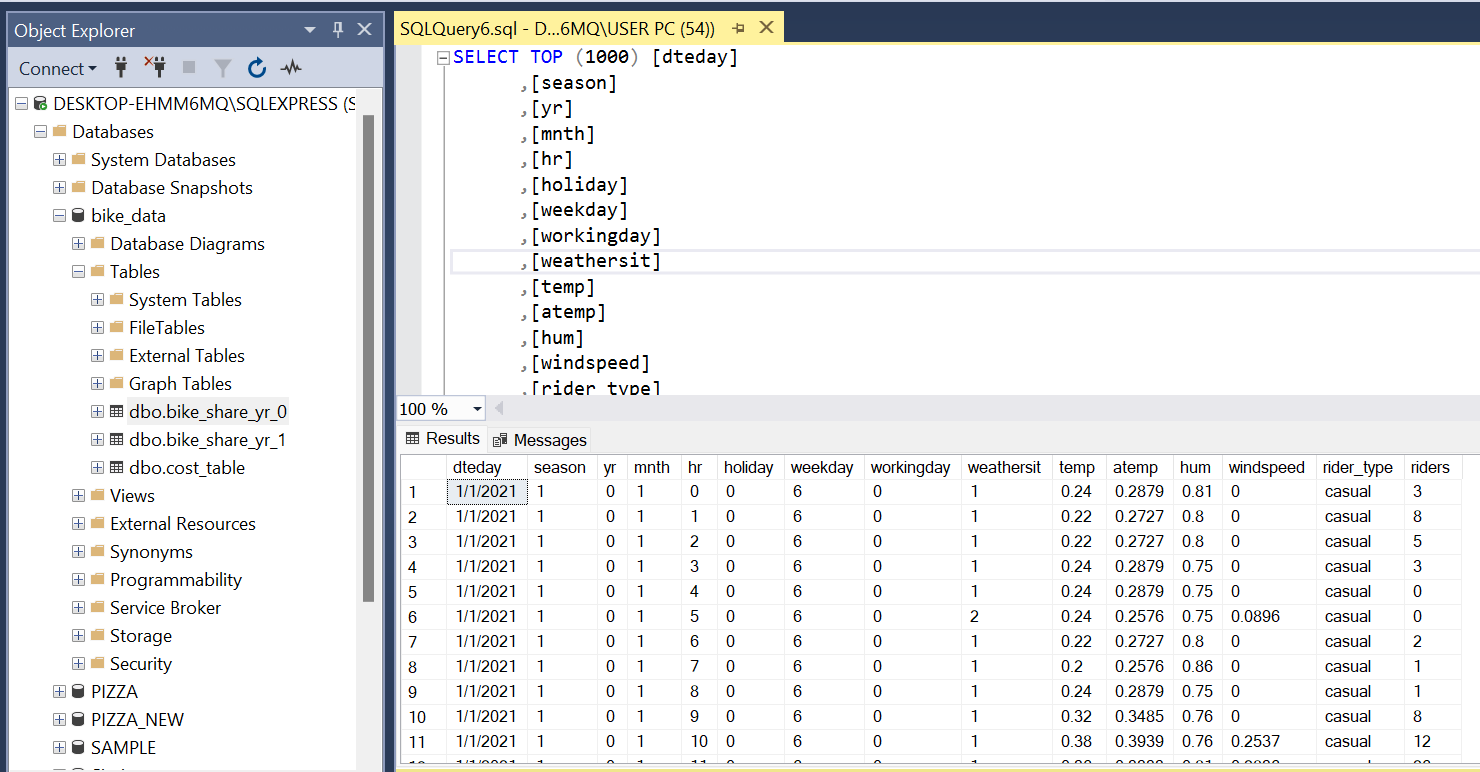
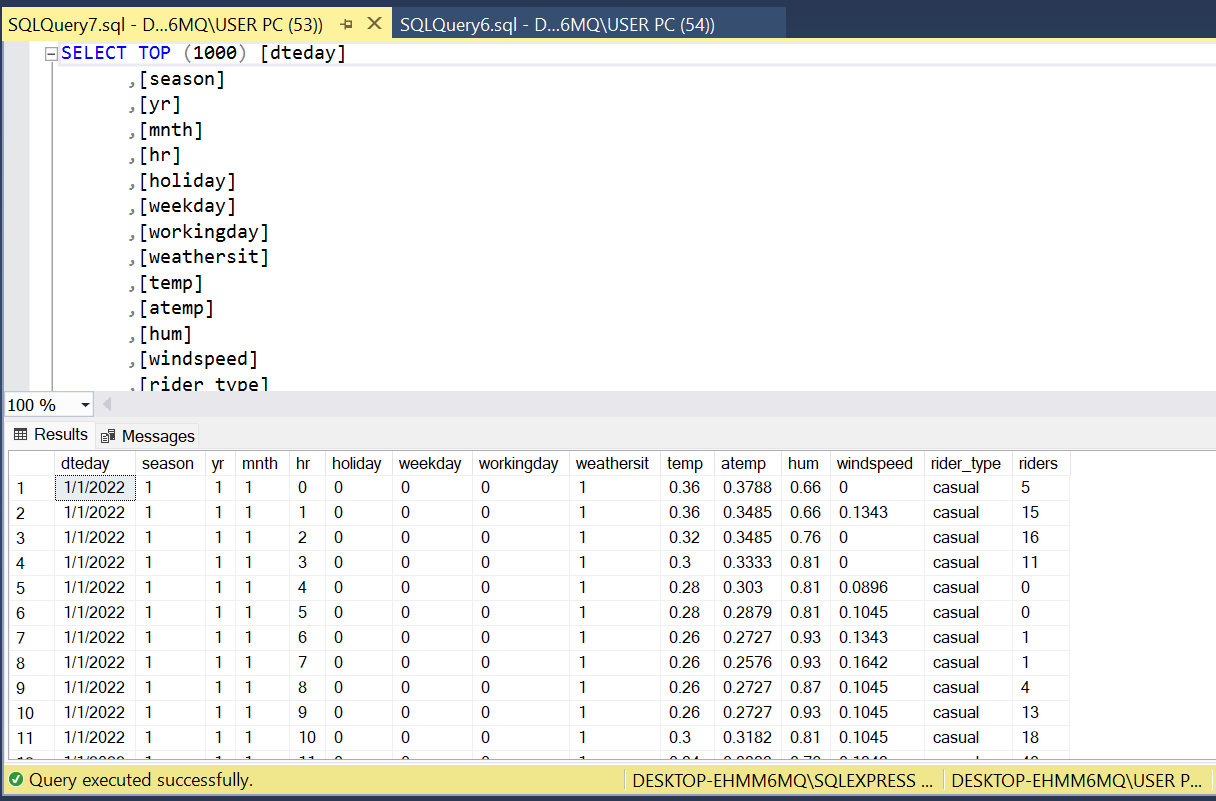
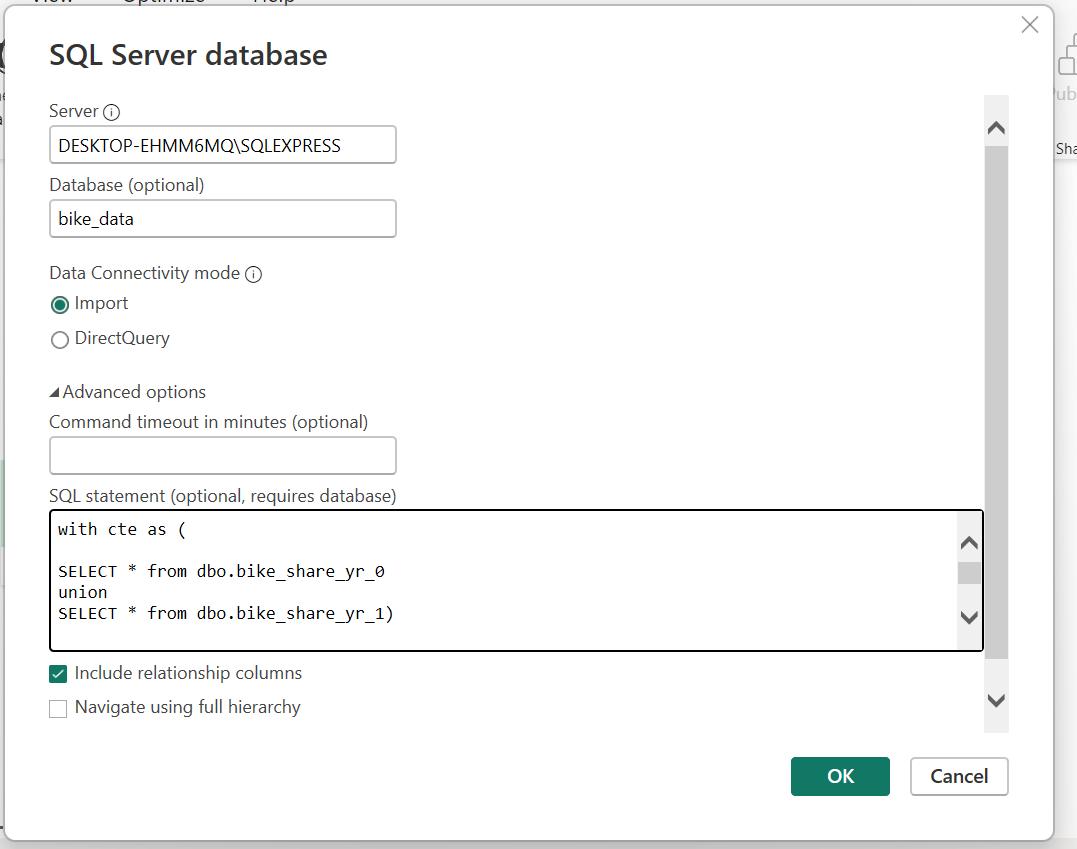
Two data sources dbo.bike_share_yr_0 i.e. year 2021 data and dbo.bike_share_yr_1 i.e. year 2022 data were provided in SQL format and were connected in the data model in a later step of the process.
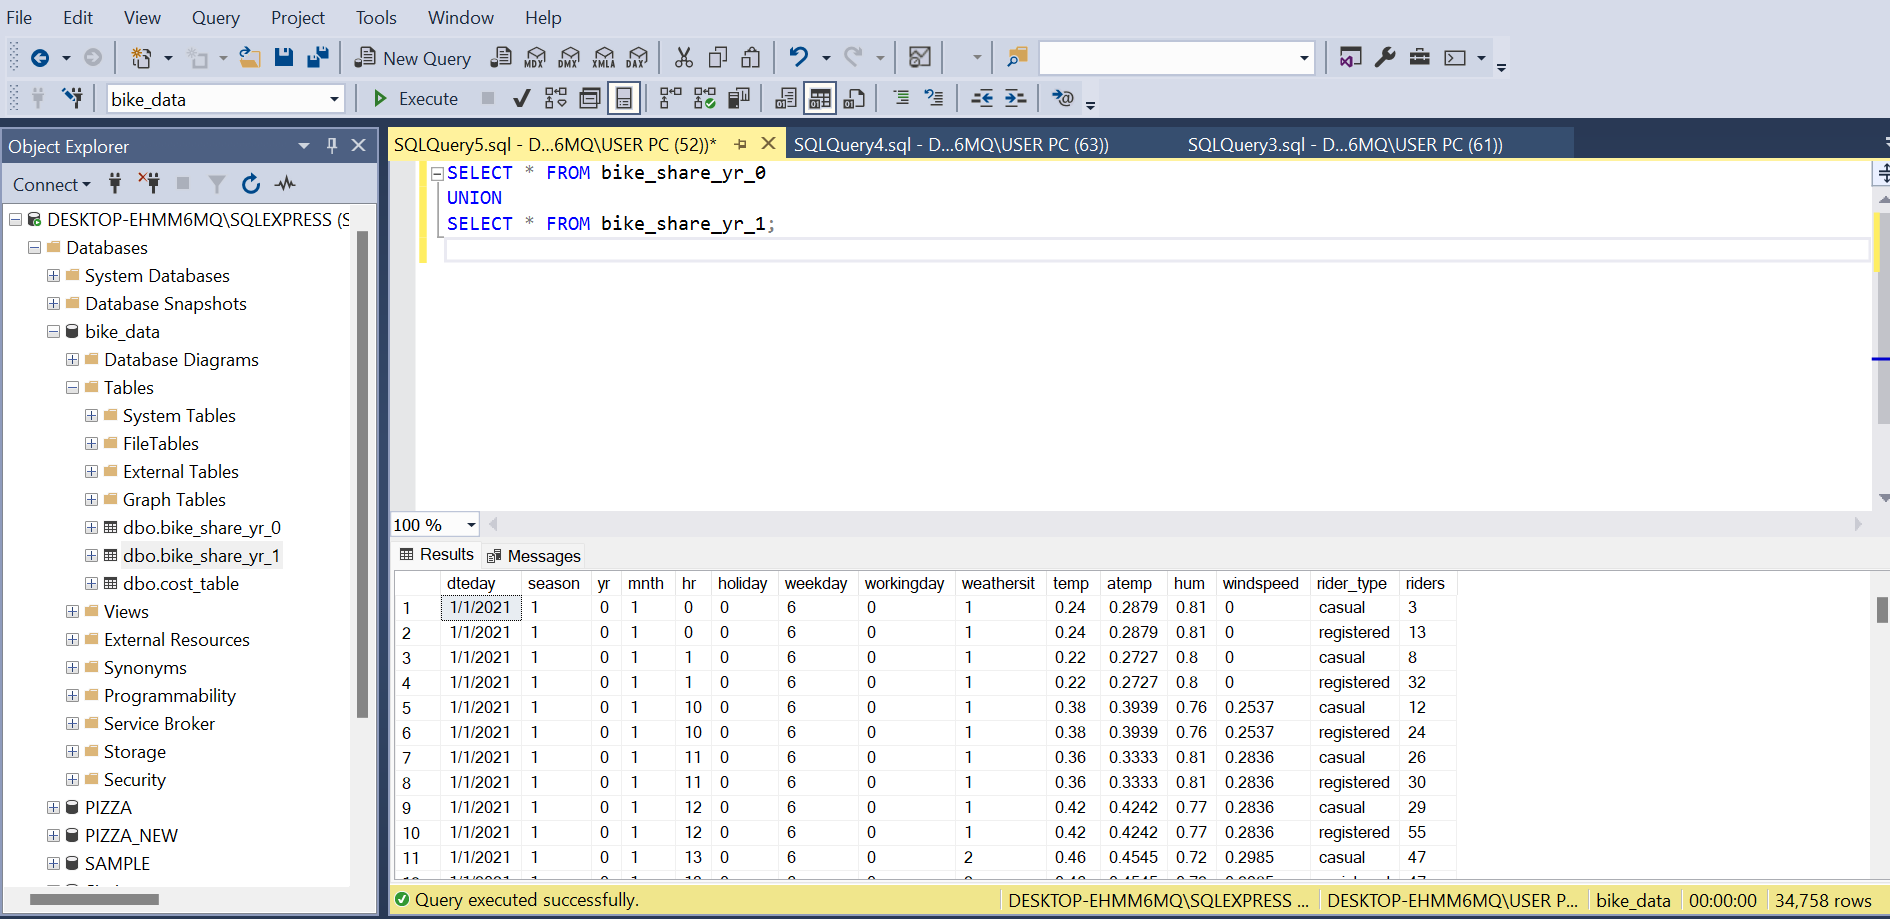
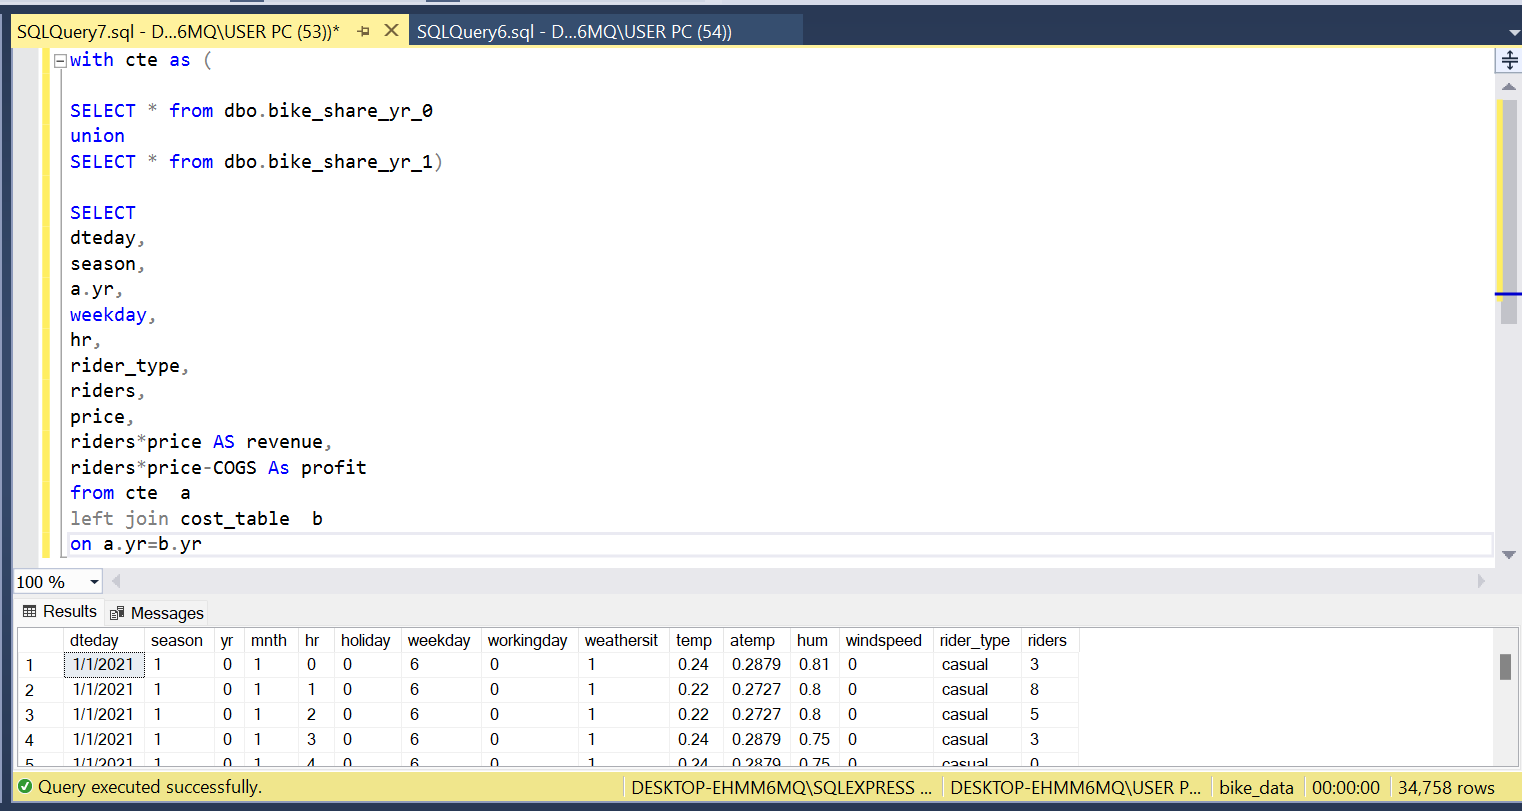
Below are the SQL statements for preparing,cleansing and transforming necessary data.
Combining the Two Tables For Year 2021 &2022
2. Using The CTE to join the Cost Table
3. Connecting PowerBi to Database
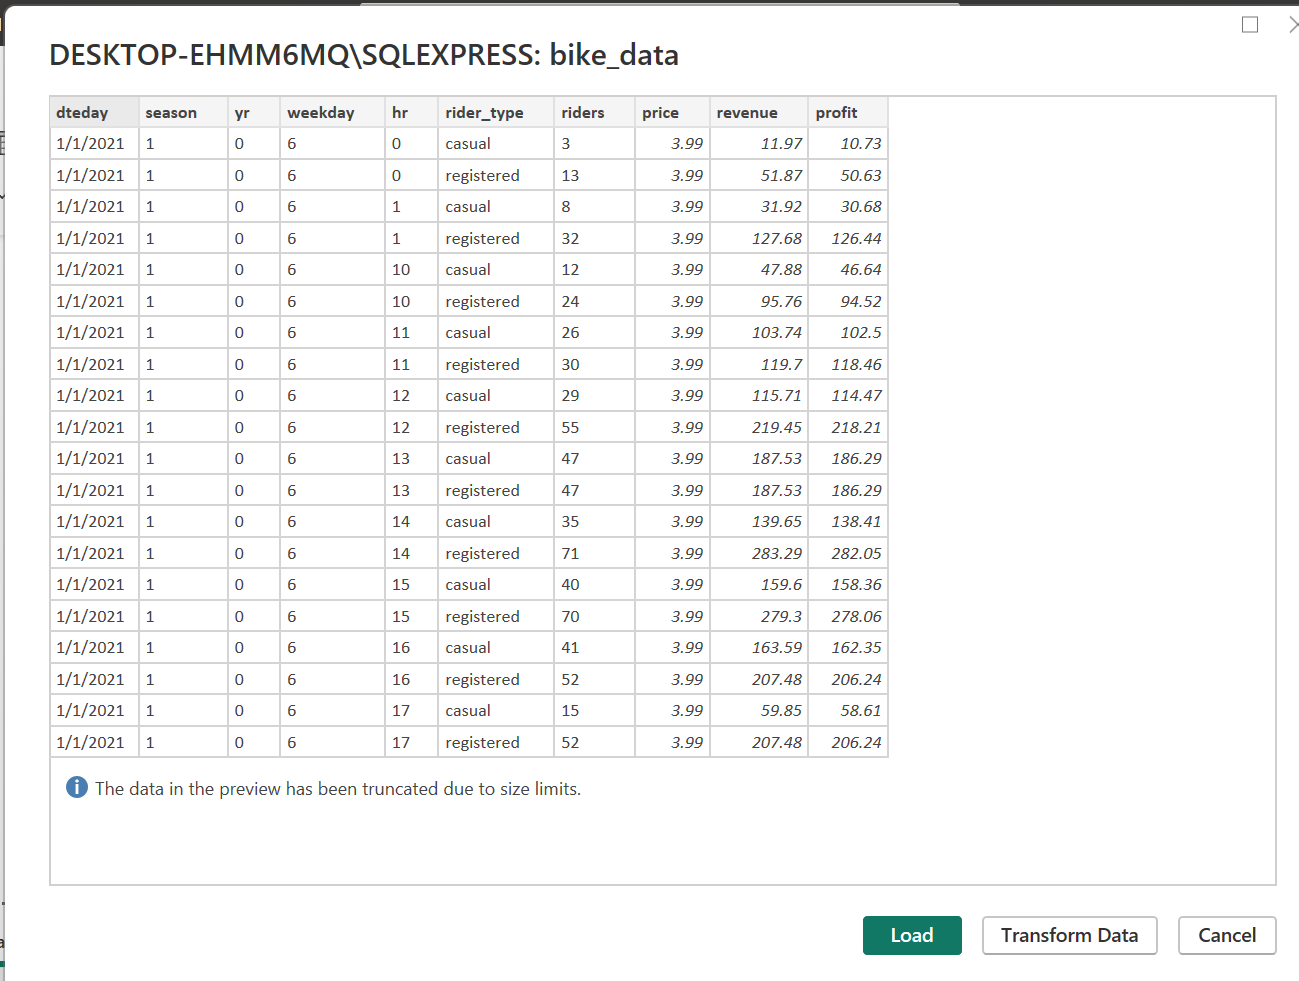
Data Model
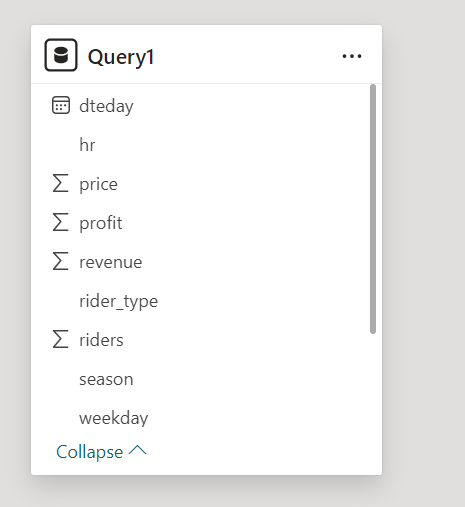
Below is a screenshot of the data model after cleansed and prepared tables were read into Power BI.
This data model also shows how bike_data(Query1) has been connected to the PowerBi Query.

4. Building a Dashboard in PowerBi
Toman Bike Share Dashboard
The finished sales management dashboard focused on displaying the key performance metrics for infromed business decision making and visualizations to show sales hourly revenue analysis, profit and revenue trends, seasonal revenue and reider demographics.
5. Recomendations & Answers to the Analysis Question
Change in Price= NP-OP/OP=0.25=25%
Demand Differences
2022= $2,049,576
2021=$1,243,103
806,473/1,243,103=0.648=65%
Price Elasticity=Increase in Demand/Increase in Price
0.648/25=2.56
RECOMMENDATIONS
Conservative Increase: Considering the substantial increase last year, a more conservative increase might be prudent to avoid hitting a price ceiling where demand starts to drop. An increase in the range of 10-15% could test the markets’ response without risking a significant loss of customers.
PRICE SETTING:
1. If the price in 2022 was $4.99, a 10% increase would make the new price about $5.49.
2. A 15% increase would set the price at approximately $5.74.
MARKET ANALYSIS:
Conduct further market research to understand customer satisfaction, potential competitive changes and the overall economic environment. This can guide whether leaning towards the lower or higher end of the suggested increase.
SEGMENTED PRICE STRATEGIES:
Consider different pricing for casual versus registered users, as they may have different price sensitivities.
MONITOR & ADJUST:
Implement the new prices but be ready to adjust based on immediate customer feedbacks and sales data. Monitoring closely will allow you to fine-tune your pricing strategy without committing fully to a price that might turn out to be too high.