Web Marketing Analysis
Business Request & User Stories
This structured approach to web marketing analysis will help uncover valuable insights, optimize marketing strategies, and enhance overall web performance. By focusing on key metrics and targeted analyses, businesses can make data-driven decisions to improve user engagement, drive growth, and achieve their marketing objectives.
Request For The Web Marketing Analysis
Dear Data Analyst
We need your expertise to develop a dashboard for our “Web Marketing Analysis” that displays our key performance metrics for informed decision-making.
Requirements
* Total Sessions
* Bounces
* Total Exits
* Average time on Page
* Top title by Pageviews
* Top countries by Pageviews
* Breakdown by Channel Groups
Design & Aesthetics: Use our company colors and ensure that the dashboard is easy to navigate.Data Source: Access to our databases will be provided.
Deadline: We need a preliminary version ASAP.
Please provide an estimated timeline for completion and recommendation based on the insightts and key-learnings deduced from the analysis
Best regards,
Project Overview:
The primary goal of this web marketing analysis is to uncover insights that can inform strategic decisions aimed at optimizing web marketing efforts. By understanding and addressing key factors, businesses can enhance their web marketing campaigns, improve user engagement, and drive growth.
Objectives:
- Identify Effective Marketing Channels: Determine which channels are driving the most traffic, engagement, and conversions.
- Evaluate Country-Specific Performance: Analyze how web marketing performance varies across different countries to tailor strategies accordingly.
- Understand Device Category Impact: Assess how different device categories (desktop, mobile, tablet) influence user behavior and campaign success.
- Optimize Content Performance: Evaluate the performance of various page titles to identify high-performing content and areas for improvement.
- Improve User Experience: Analyze metrics related to page load time, bounces, and exits to enhance website usability and user experience.
- Enhance Source/Medium Effectiveness: Determine the effectiveness of various source/medium combinations in driving quality traffic.
Key Metrics:
-
Sessions: Total number of sessions initiated by users. This indicates the volume of traffic generated by marketing efforts.
-
Pageviews: Total number of pages viewed by users. This helps to understand the level of user engagement with website content.
-
Unique Pageviews: Number of unique pages viewed by users in a session. This Provides insights into the distinct content accessed by users.
-
Bounces: Number of single-page sessions where users left without interacting further. A high bounce rate may indicate issues with landing pages or irrelevant traffic.
-
Exits: Number of times users exited the website from a specific page. This helps to identify pages where users tend to leave the website.
-
Page Load Time: Average time taken for a page to load. It is important for understanding user experience and its impact on engagement.
-
Time on Page: Average amount of time users spend on a page. This indicates the level of interest in the content.
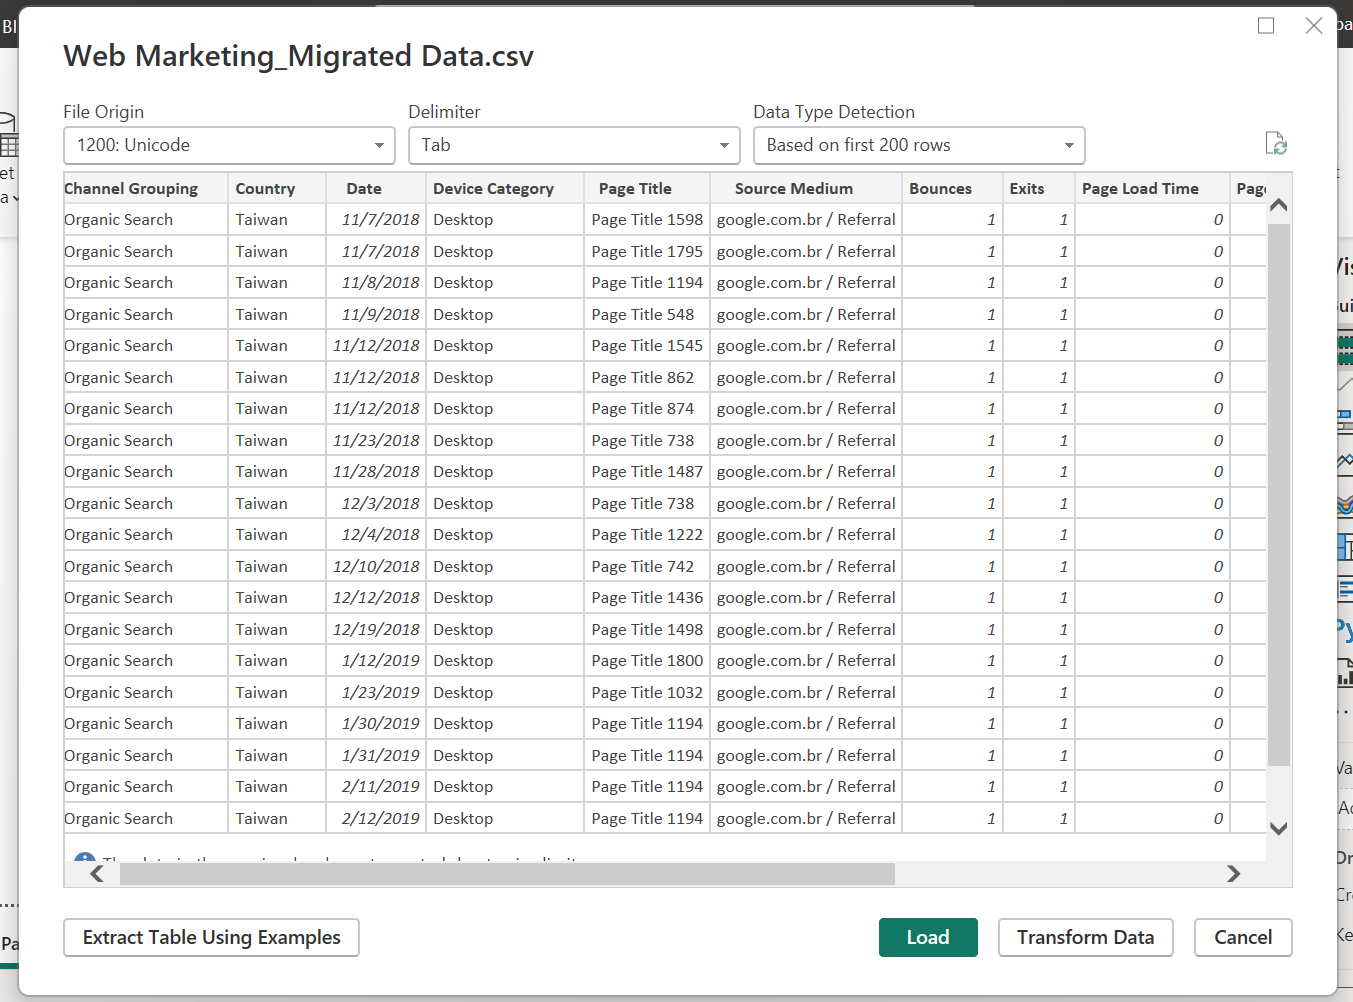
1. Data Collection/Preparation
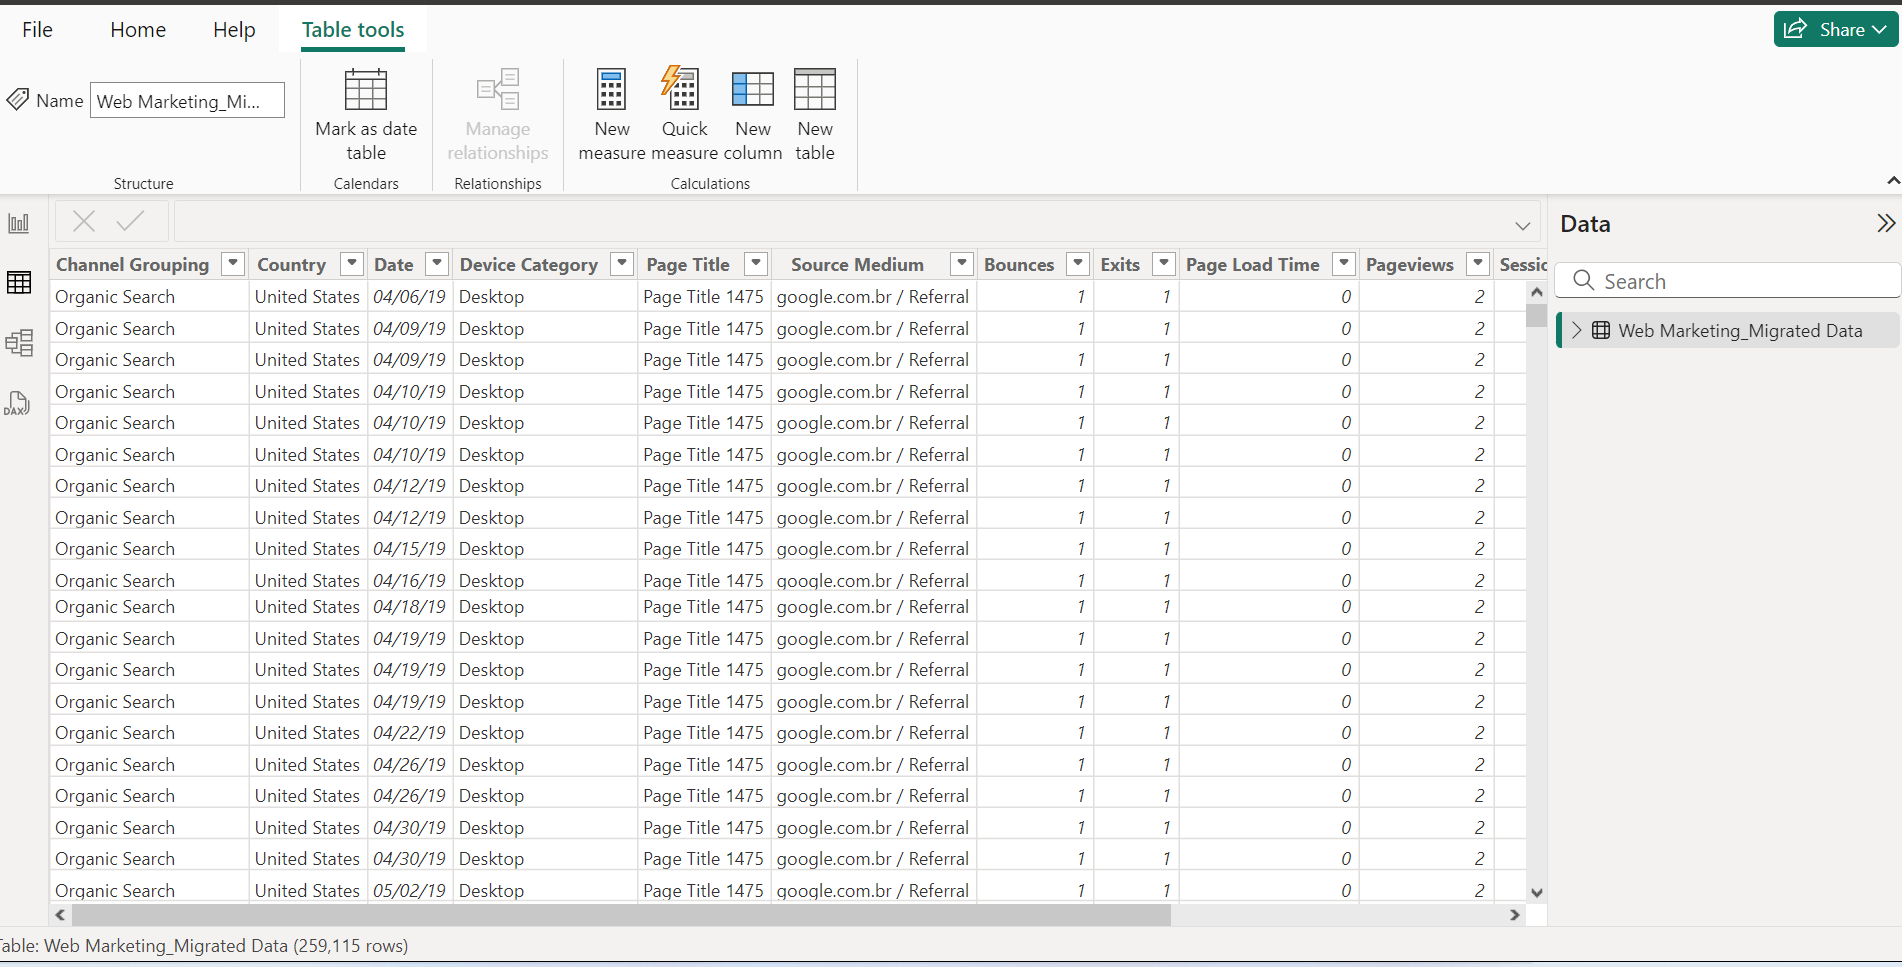
2. Data Viewing

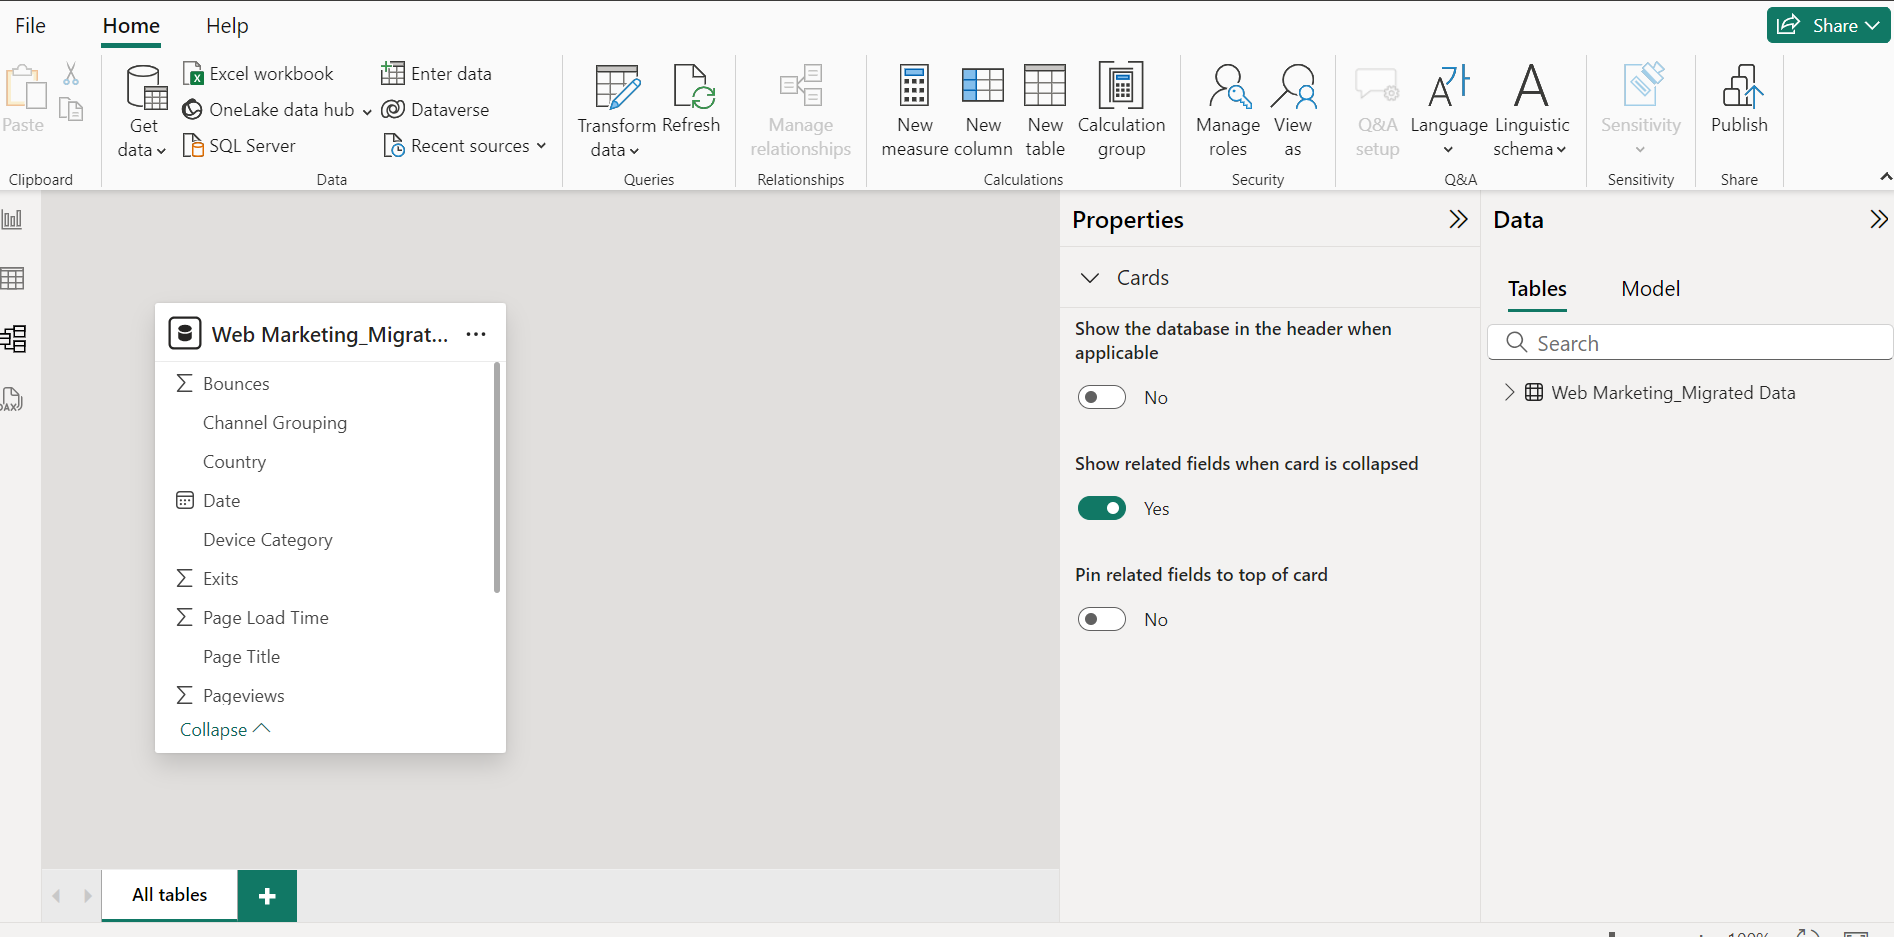
3. Data Tables & Models

4. Data Visualization
5. Insights & Recommendations
1. Bounce Rate Analysis:Overall Bounce Rate:(90,216/418,062)×100≈21.6%Desktop Bounce Rate:(55,884/292,287)×100≈19.1%Mobile Bounce Rate:(31,751/113,691)×100≈27.9%Tablet Bounce Rate:(2,581/12,084)×100≈21.4%2. Exit Rate AnalysisOverall Exit Rate:(139,000/418,062)×100≈33.2%3. Device Category Insights:Desktop:Highest number of sessions, indicating strong engagement from desktop users.Lowest bounce rate, suggesting desktop users find the content more engaging or the website is better optimized for desktop.Mobile:Second-highest number of sessions.Highest bounce rate, indicating potential issues with mobile user experience or content relevance.Tablet:Lowest number of sessions.Bounce rate slightly higher than desktop but lower than mobile.4. Geographical Insights:Top Countries by Unique Page Views:The U.S. leads significantly, followed by India, France, the U.K., and Switzerland. This indicates a diverse international audience with a strong presence in the U.S.5. Monthly Traffic Trends:Traffic shows a steady increase from January to August, with August having the highest sessions (30k). This indicates a seasonal increase in interest or effectiveness of marketing efforts over time.Recommendations: 1. Optimize Mobile Experience:Issue: High bounce rate on mobile devices suggests usability or content relevance issues.Recommendation:Ensure the website is mobile-friendly and responsive.Simplify navigation and improve loading times on mobile.Optimize content for mobile viewing, ensuring it is concise and engaging.2. Improve Page Load Time:Issue: Average page load time of 54 seconds is significantly high and likely causing high bounce rates and exits.Recommendation: Optimize images, leverage browser caching, and minimize JavaScript to reduce load time.Use a content delivery network (CDN) to speed up content delivery.3. Enhance Content Engagement:Issue: Overall bounce rate (21.6%) and high exit rates suggest users are not finding what they need or losing interest.Recommendation: Conduct A/B testing on landing pages to identify and implement changes that reduce bounces.Enhance the relevance of content by analyzing user intent and tailoring content to meet those needs.Use engaging visuals and interactive elements to retain users’ attention.4. Targeted Desktop Campaigns:Insight: Desktop users show high engagement and lower bounce rates.Recommendation:Invest in desktop-specific marketing campaigns to leverage this high-engagement user base.Offer promotions or content specifically tailored to desktop users.5. Localized Marketing Strategies:Insight: High engagement from the U.S. followed by India, France, the U.K., and Switzerland.Recommendation:Develop localized marketing strategies for these top countries to enhance engagement.Consider language, cultural preferences, and local trends in content and campaigns.6. Analyze Monthly TrendsInsight from the Monthly Trends: Increasing traffic from January to August indicates seasonal trends.Recommendation:Identify the factors contributing to the increase in traffic and replicate successful strategies.Plan for seasonal campaigns to capitalize on peak interest periods.7. Exit Rate Reduction:Issue: High exit rate (33.2%) suggests users may be leaving without completing desired actions.Recommendation:Analyze exit pages to understand why users are leaving and optimize those pages.Implement clear calls-to-action (CTAs) to guide users toward desired actions before they exit.Use retargeting strategies to bring back users who have exited the site without converting.Conclusion: By addressing the identified issues and implementing the recommendations, the business can enhance its web marketing efforts, reduce bounce rates, improve user engagement, and ultimately drive higher conversions. Regular analysis and optimization will ensure that the web marketing strategy remains effective and responsive to user needs.