Marketing Campaign Insight Analysis
Business Request & User Stories
This project explains how to analyze marketing campaign insight data using Power BI. Marketing campaign insight refers to the knowledge gained through analyzing data related to a marketing campaign, and how this knowledge can help businesses make informed decisions about their marketing strategies and tactics. Overall, this project provides a helpful guide on how to analyze marketing campaign insight data using Power BI, with clear instructions and practical instances.
Request For The Marketing Campaign Analysis
Dear Data Analyst
We need your expertise to develop a dashboard for our “Marketing Campaign Analysis” that displays our key performance metrics for informed decision-making.
Requirements
Create a visualization to analyse;
* The relationship between income and spending of our customers
* The relationship between spending and education
* Customer Complaints
* Customer Purchase History
Design & Aesthetics: Use our company colors and ensure that the dashboard is easy to navigate.Data Source: Access to our databases will be provided.
Deadline: We need a preliminary version ASAP.
Please provide an estimated timeline for completion and recommendation based on the insightts and key-learnings deduced from the analysis
Best regards,
Project Overview:
The primary goal of this analysis is to uncover insights that can inform strategic decisions aimed at optimizing marketing campaigns. By understanding and addressing key factors, businesses can improve their marketing effectiveness and overall campaign performance.
Objectives:
- Customer Segmentation: Identify distinct customer segments based on demographics, purchasing behavior, and campaign responses.
- Campaign Effectiveness: Assess the effectiveness of different marketing campaigns and identify which campaigns generate the highest customer engagement and conversion.
- Purchase Behavior Analysis: Analyze customer purchase patterns to identify popular products and potential cross-selling opportunities.
- Customer Loyalty and Retention:Evaluate factors influencing customer loyalty and retention, including recency of purchases and frequency of store visits.
- Response Rate Analysis:Determine the response rates to various campaigns and identify characteristics of customers who are more likely to respond.
- Predictive Modeling:Develop predictive models to identify potential responders to future campaigns based on historical data.
Key Metrics:
- Customer Demographics:Year of Birth,Education Level,Marital Status, Income,Number of Children (Kidhome),Number of Teenagers (Teenhome).
- Purchase Behavior:Total spent on different product categories (Wines, Fruits, Meat, Fish, Sweets, Gold),Number of purchases through different channels (Deals, Web, Catalog, Store),Number of website visits in the last month (NumWebVisitsMonth).
- Campaign Interaction:Response to previous campaigns (AcceptedCmp1, AcceptedCmp2, AcceptedCmp3, AcceptedCmp4, AcceptedCmp5), Complaints (Complain).
- Customer Loyalty:Recency of last purchase (Recency), Date of becoming a customer (Dt_Customer).
The project workflow is explained below;
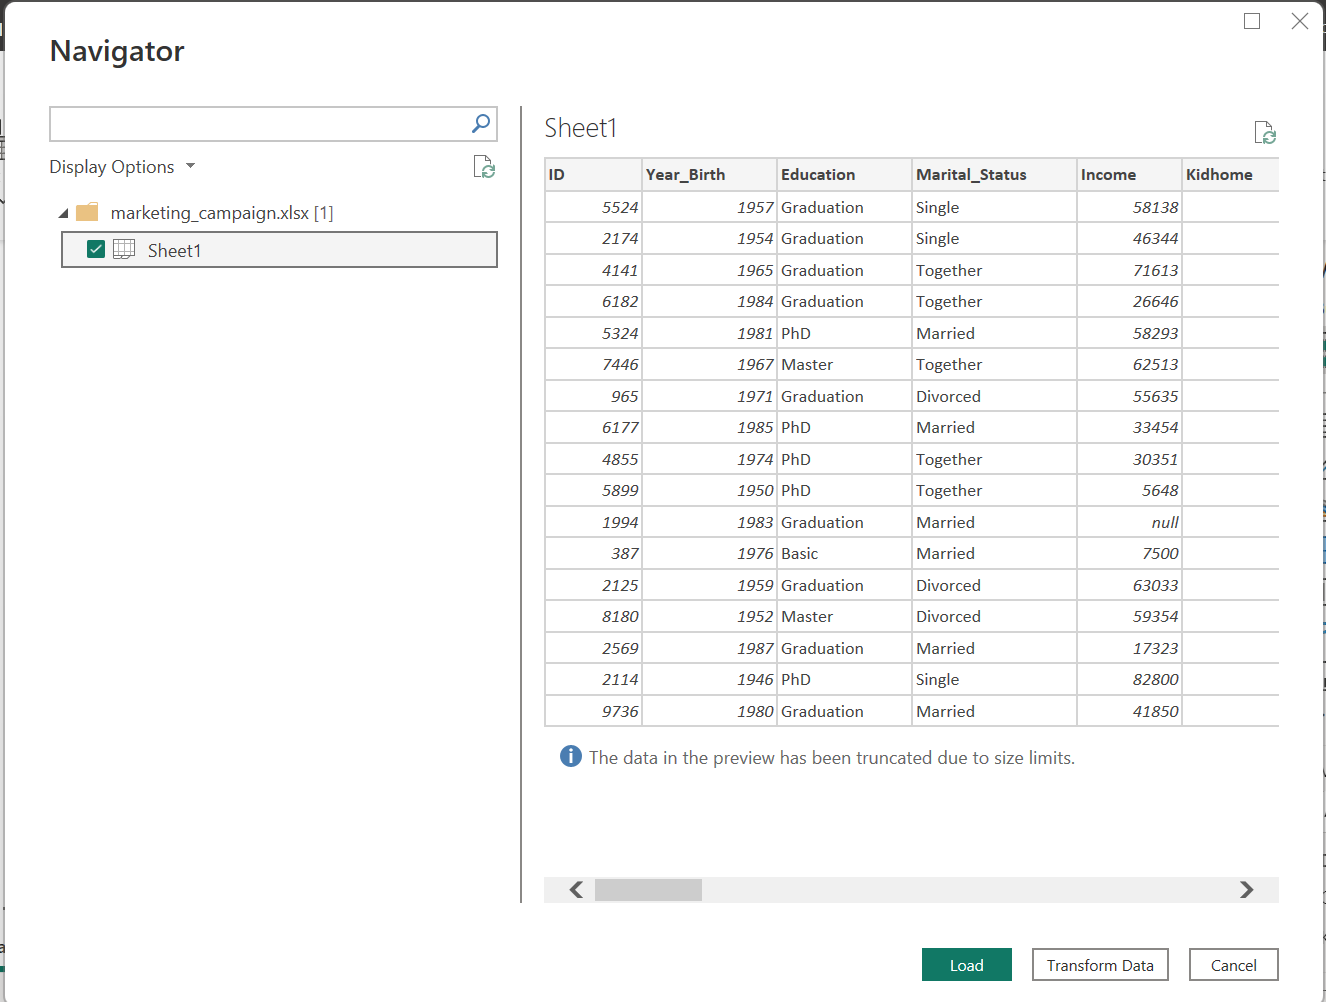
1. Data Collection
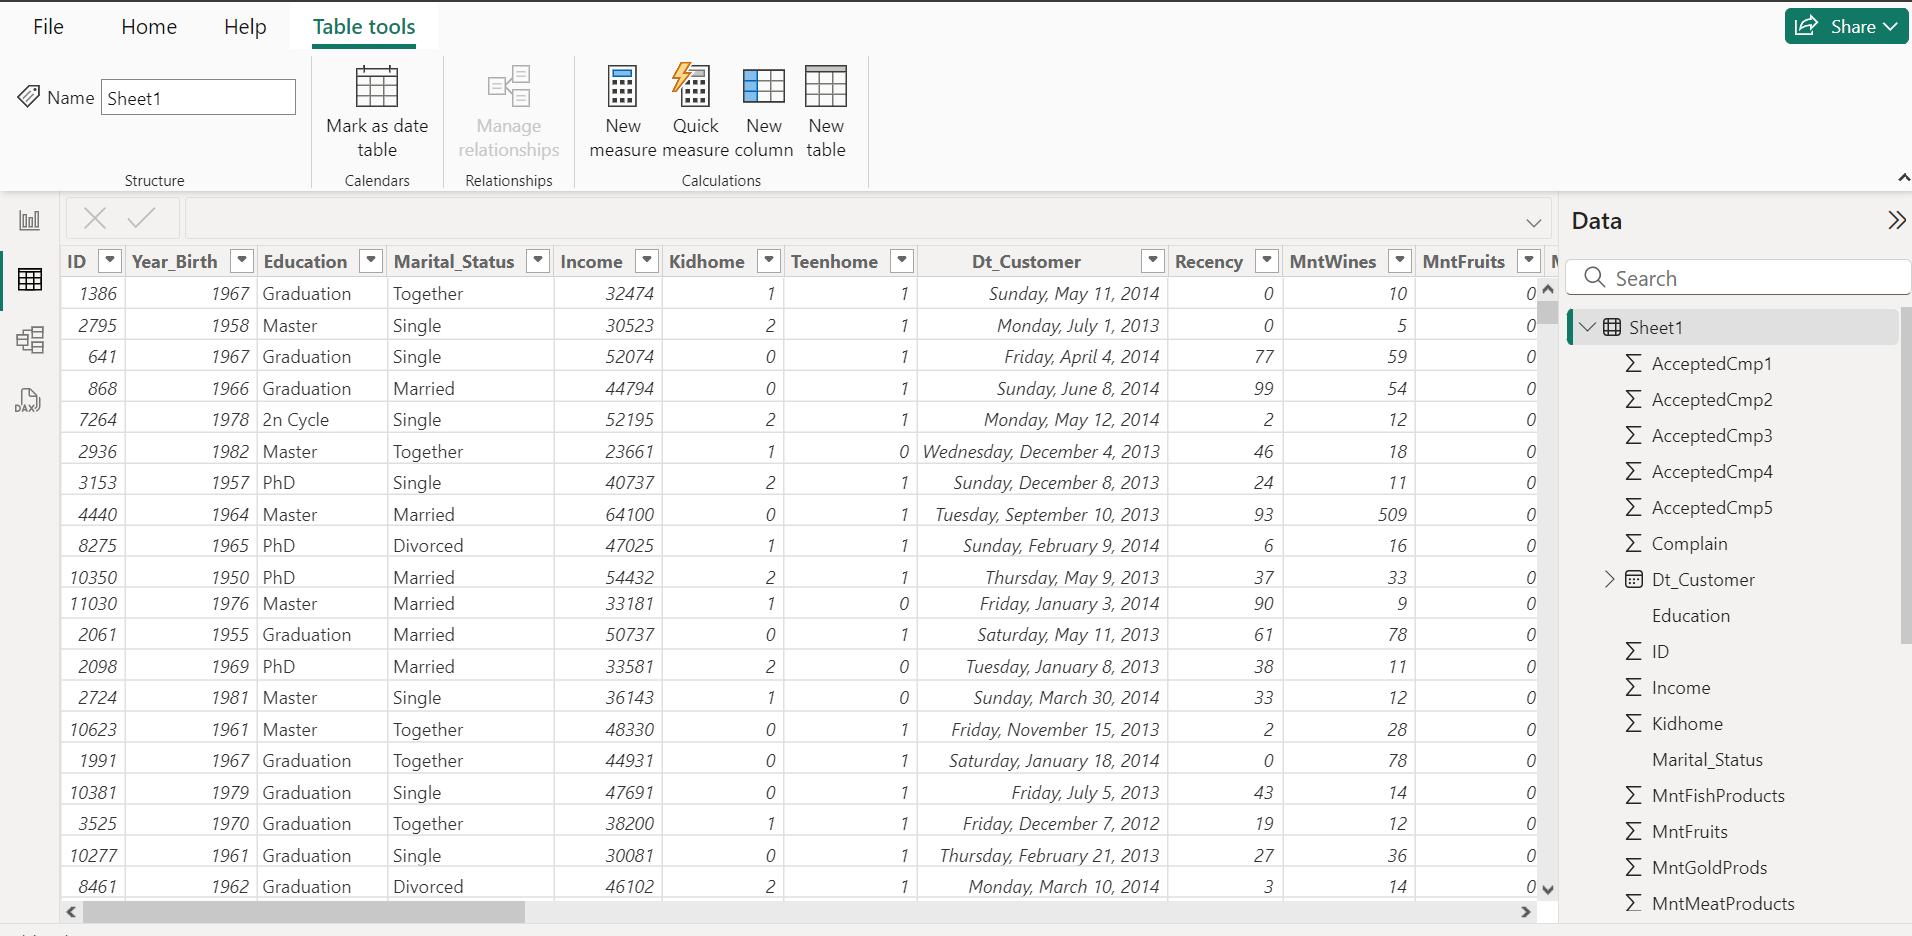
2. Data Preparation
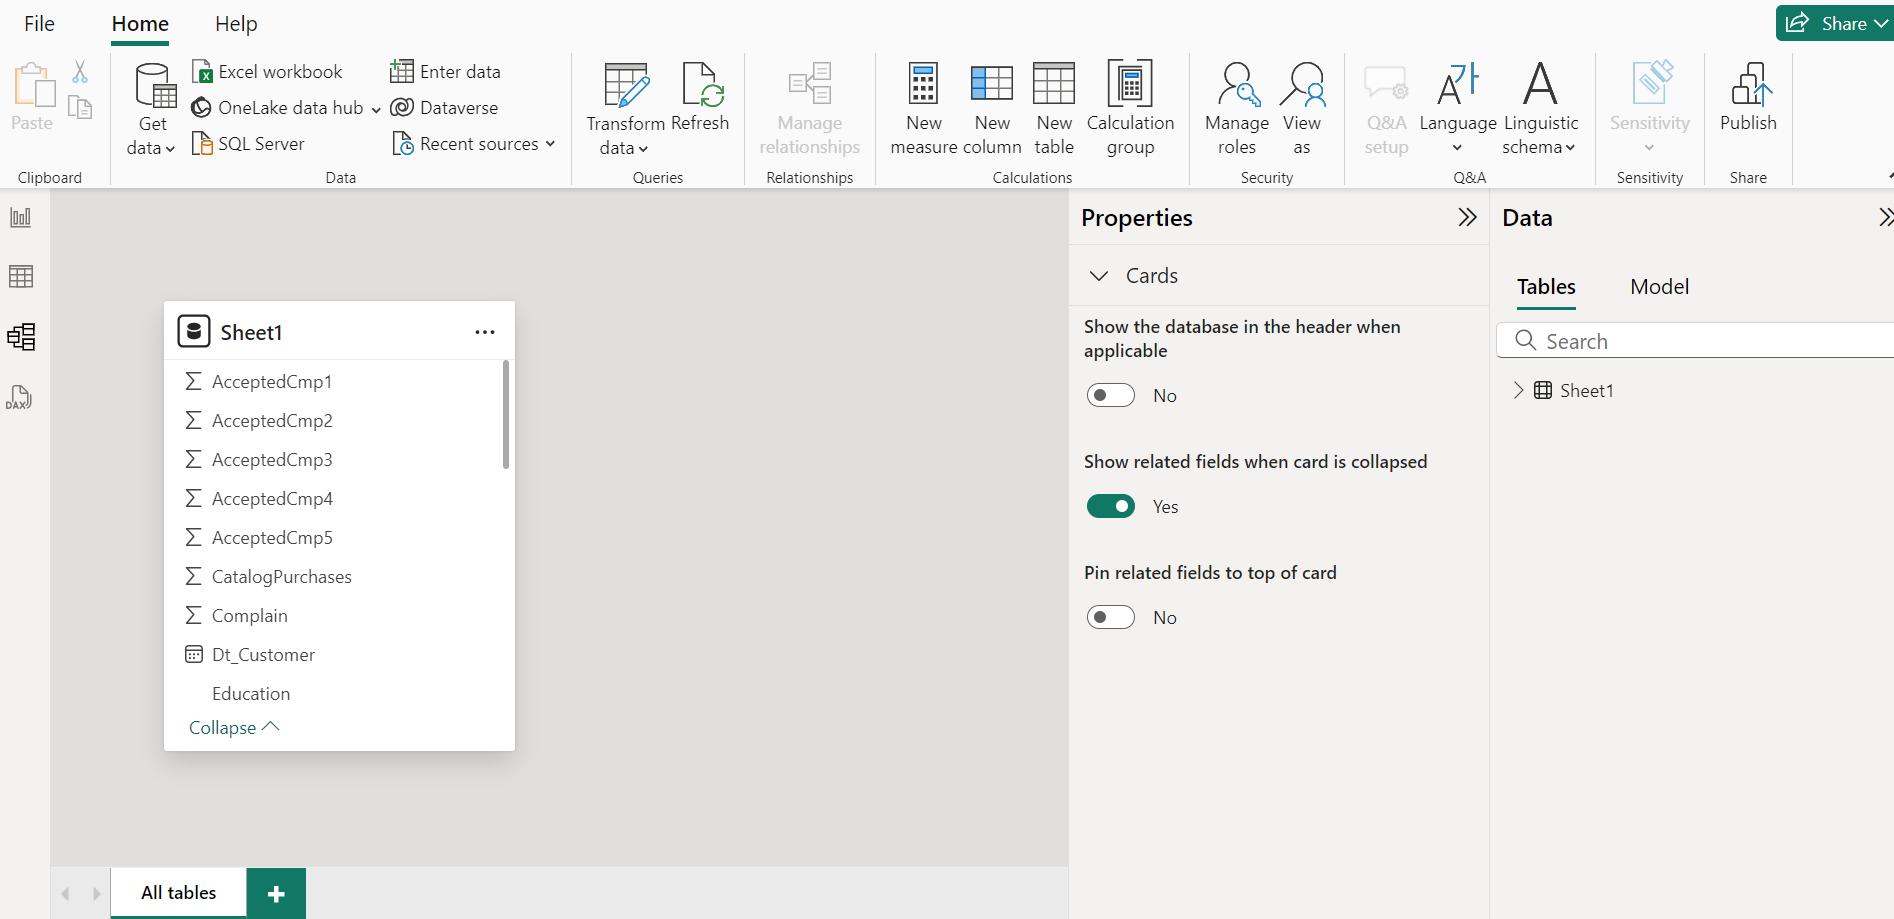
3. Data Modelling
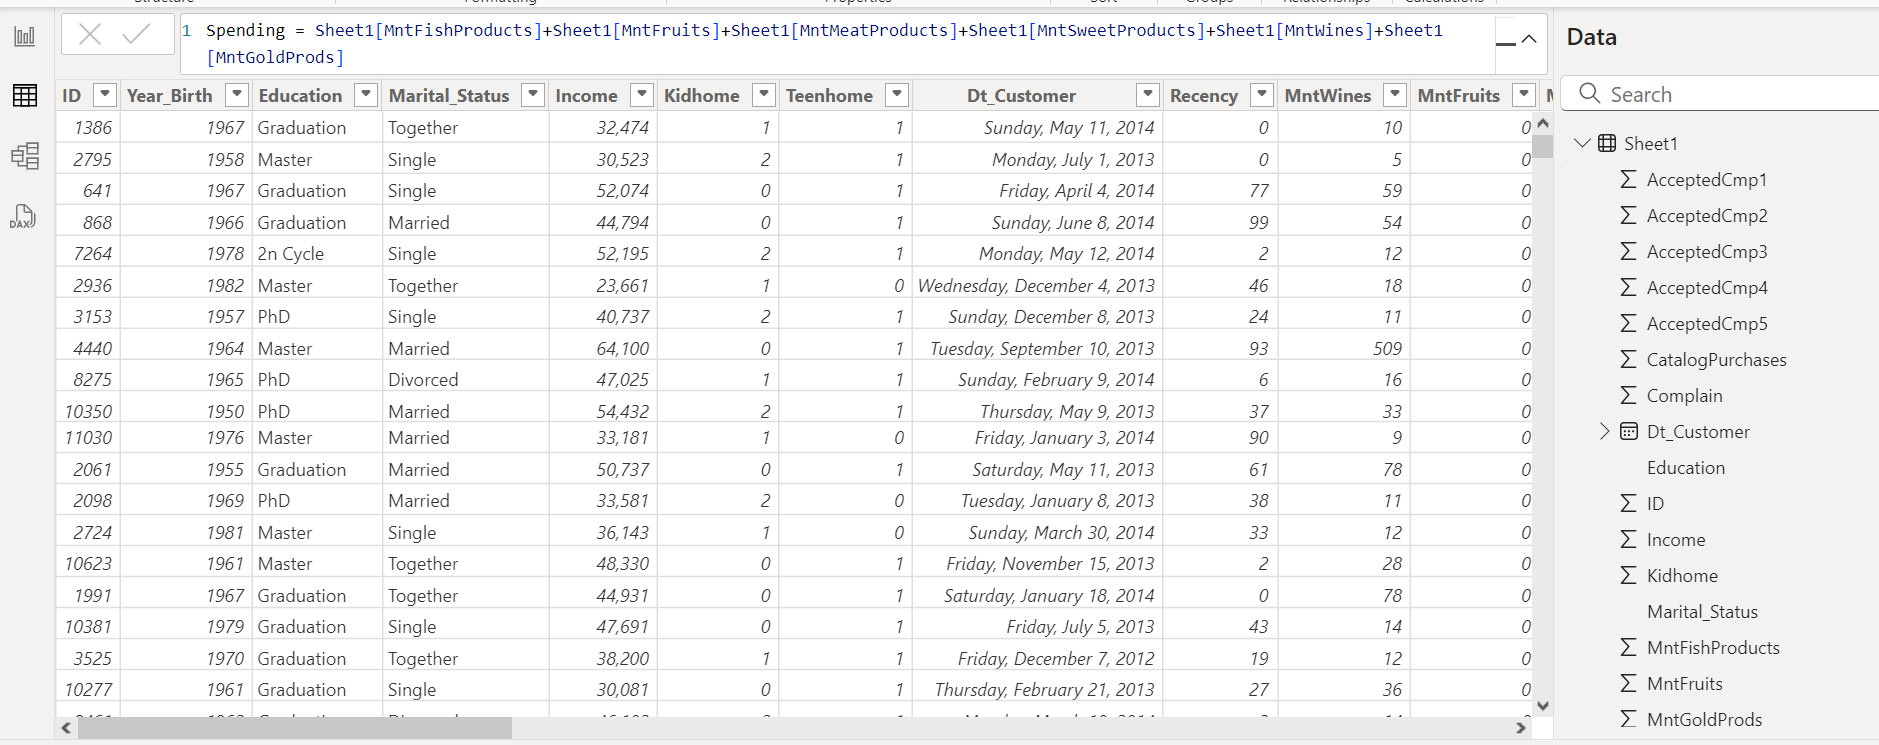
4. Data Analysis
5. Data Visualization
6. Insights & Key-Learnings
1. Data Collection

2. Data Preparation

3. Data Modelling

4. Data Analysis

5. Data Visualisation
6. Insights & Key-Learnings
1. Purchases Distribution:
Insight: The majority of purchases are made in-store, followed by web purchases. Catalog and deal purchases are less common but still significant.
2. Campaign Acceptance Rates:
Insight: Campaign 4 has the highest acceptance rate, while Campaign 2 has the lowest. Campaigns 1, 3, and 5 have similar acceptance rates, indicating they are relatively well-received.
3. Income Spending by Year and Quarter:
Insight: Income spending shows fluctuations over the quarters, with a notable dip in Q3 2012. There is a general trend of increasing income over the period.
4. Complaints by Year and Quarter:
Insight: Complaints are highest in Q1 2012 and Q3 2013, with fewer complaints in other quarters. This suggests certain periods may have had issues that impacted customer satisfaction.
5. Education:Customers with Graduation level, PhD and Masters spend most on wines and meat.
Recommendations:
1. Optimize In-Store and Web Purchase Channels:Store and Web Purchases: Since these channels account for the majority of purchases, continue investing in enhancing the in-store experience and optimizing the online shopping platform.Action: Implement targeted promotions and loyalty programs for in-store and online customers to further boost engagement and sales.2. Revise and Improve Campaign 2:Low Acceptance Rate: Campaign 2 has the lowest acceptance rate.Action: Conduct a detailed analysis to understand why Campaign 2 underperformed. Consider revising the campaign content, targeting, and delivery method based on customer feedback and preferences.3. Leverage Successful Campaigns:Campaigns 3, 4, and 5: These campaigns have high acceptance rates.Action: Analyze the elements that made these campaigns successful (e.g., messaging, offers, timing) and apply these insights to future campaigns. Consider running similar campaigns to maintain high engagement.4. Monitor and Address Seasonal Fluctuations in Income:Income Trends: There are significant fluctuations in income spending across different quarters.Action: Investigate the reasons for these fluctuations (e.g., seasonal trends, market conditions). Develop strategies to stabilize income, such as introducing off-season promotions or diversifying product offerings.5. Reduce Customer Complaints:Complaint Analysis: High complaints in Q1 2012 and Q3 2013 indicate potential issues during these periods.Action: Conduct a root cause analysis of the complaints to identify underlying issues. Implement corrective measures to prevent similar issues in the future. Enhance customer service and feedback mechanisms to quickly address and resolve complaints.Conclusion:By leveraging the insights gained from this analysis, the business can optimize its marketing campaigns, enhance customer engagement, and improve overall performance. Regular monitoring and adjustment based on data-driven insights will ensure that the marketing strategy remains effective and responsive to changing customer needs and market conditions.