Sales Conversion Rate Analysis
Business Request & User Stories
MAIL FROM THE STAKEHOLDER
Subject: Understanding Our Sales Success?
Dear Awesome Data Analyst,
I hope this email finds you well.
I’ve been looking at the number of people we’ve reached out to, both online and offline, over the past few months. We’ve had some amazing marketing campaigns, and the feedback has been great, with lots of inquiries and website visits.
However, I’m trying to understand how well we’re doing in terms of turning these potential customers or leads into actual sales. Are we effective in our follow-ups? Which channels or campaigns are giving us the best outcomes in terms of sales? I’m sure there’s a way to measure this, right?
For our next strategy meeting, could you help me with some insights into this? I think it’ll help us focus our efforts better and maybe identify areas we need to improve. A visual breakdown would be really helpful, something I can share with the team.
I always appreciate your insights. You have a knack for making sense of these numbers!
Thank you and looking forward to what you find.
Best wishes,
Charlie Thompson
Head of Outreach Initiatives
USER STORIES
1.Identifying Conversion Needs: As the Head of Outreach Initiatives, I want to gauge the effectiveness of our campaigns by understanding the rate at which potential customers turn into actual sales.
2.Channel Efficiency Analysis: As the Head of Outreach Initiatives, I want to see which channels or campaigns have the highest conversion rates to allocate resources effectively.
3.Improvement Areas Identification: As the Head of Outreach Initiatives, I want to identify areas of low conversion to strategize and improve our success rate.
4.Visual Overview for Team Sharing: As the Head of Outreach Initiatives, I want a visual breakdown of our conversion success across channels and campaigns for easy team sharing and discussions.
5.Lead to Sale Journey Insights: As the Head of Outreach Initiatives, I want insights into the journey from lead to sale to pinpoint bottlenecks or inefficiencies.
SELECTED KPI
Sales Conversion Rate: Measures the Percentage of Potential Customers who Complete a Purchase.
Example: In March, 1,500 people expressed interest in our product, but only 250 finalized their purchases. This yields a sales conversion rate of 16.67%.
Application: Evaluating the sales conversion rate offers insights into the success of our sales pitches and strategies. It helps spotlight areas that might need refinement and assists in optimizing both our marketing approach and sales funnel for better outcomes.
Project Overview:
The primary aim of this project is to analyze and understand how effectively potential customers or leads are being converted into actual sales. By examining the effectiveness of follow-ups, identifying the best-performing channels or campaigns, and understanding the factors influencing conversions, the business can optimize its strategies to improve sales conversion rates.
Objectives:1.Evaluate Conversion Effectiveness:Measure and evaluate the overall sales conversion rate.Assess the effectiveness of follow-up actions on lead conversions.2.Channel and Campaign Performance:Identify which lead sources (channels) and campaigns yield the highest conversion rates.Analyze the performance of different channels and campaigns in terms of lead conversion.3.Product and Segment Analysis:Determine which product categories have the highest and lowest conversion rates.Analyze conversion rates across different customer segments and regions.4.Time-Based Analysis:Analyze conversion rates over different time periods to identify trends and seasonality.
Key Metrics:1.Overall Conversion Rate2.Conversion Rate by Lead Source3.Conversion Rate by Product Category4. Conversion Rate by Customer Segment5.Conversion Rate by Region6.Time-Based Conversion Analysis
The project workflow is explained below;
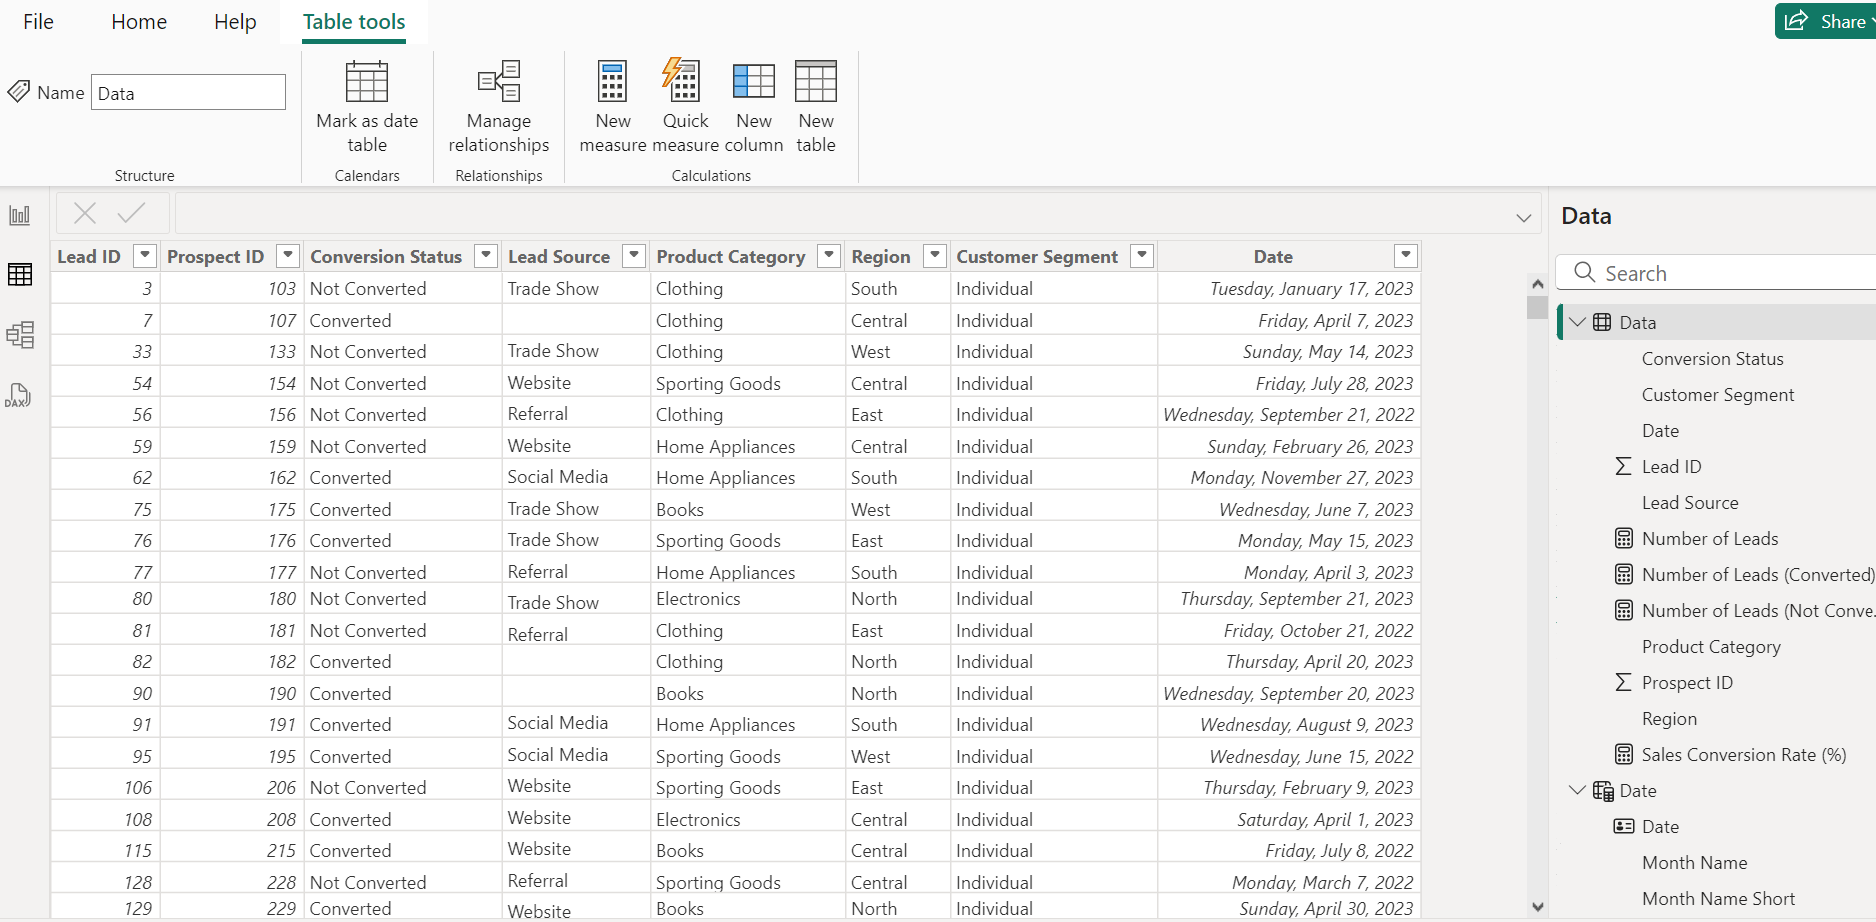
1. Data Collection
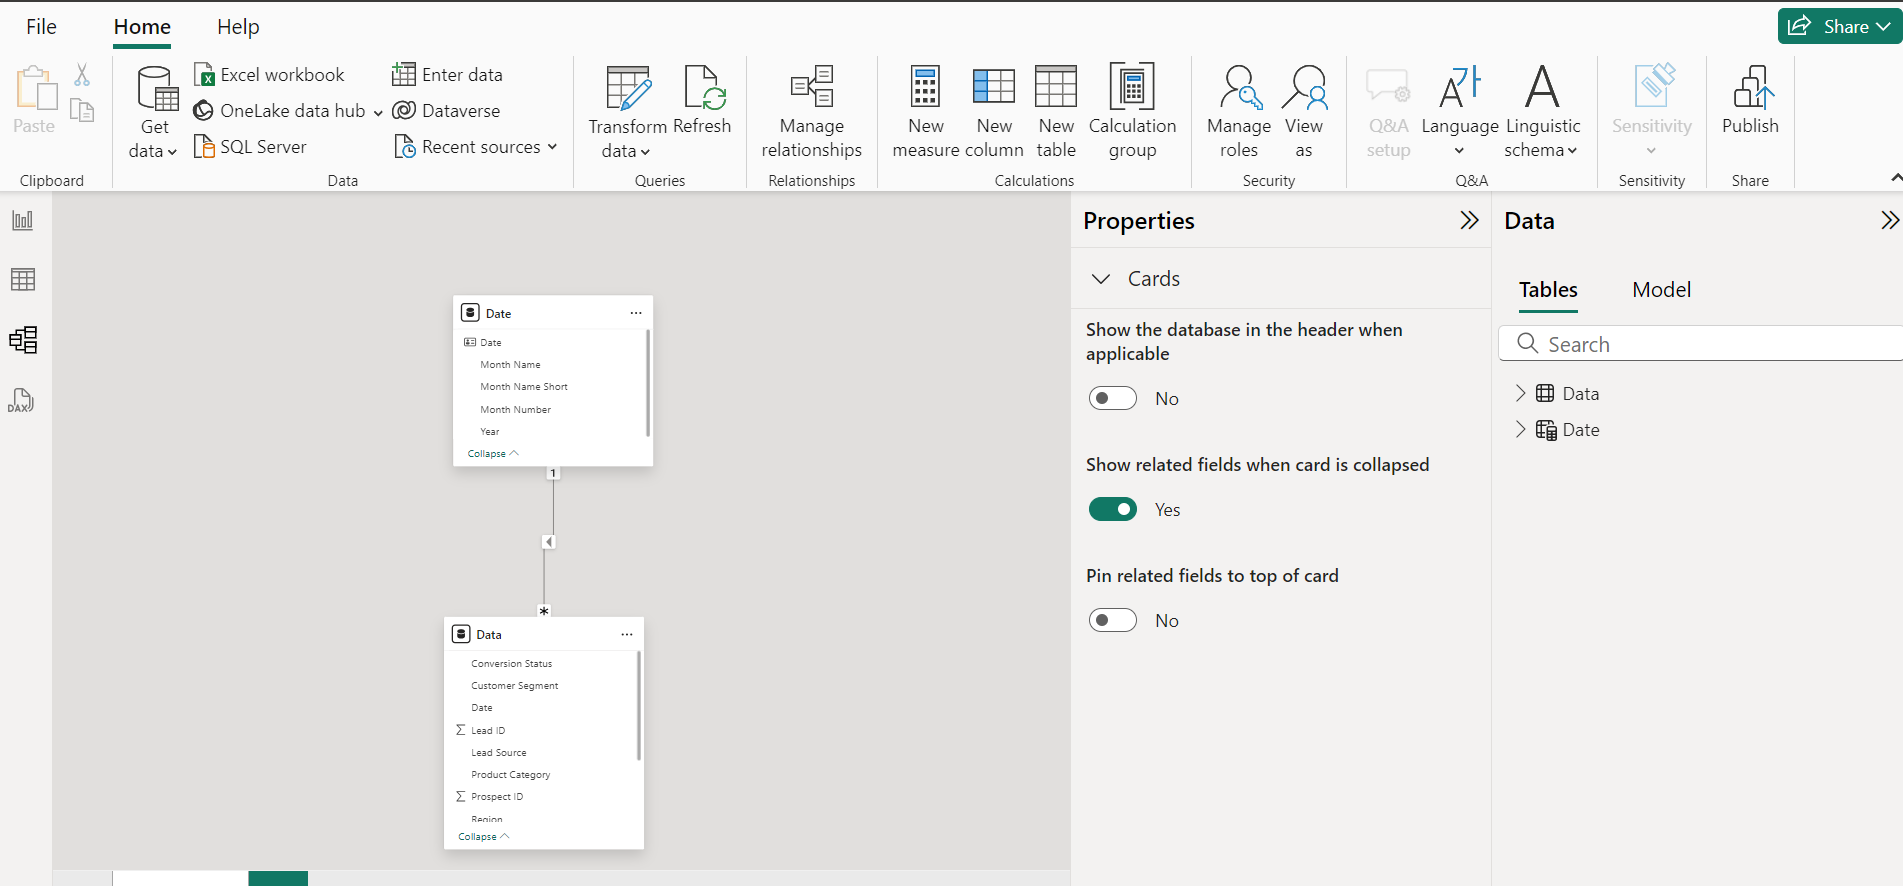
2. Data Modelling
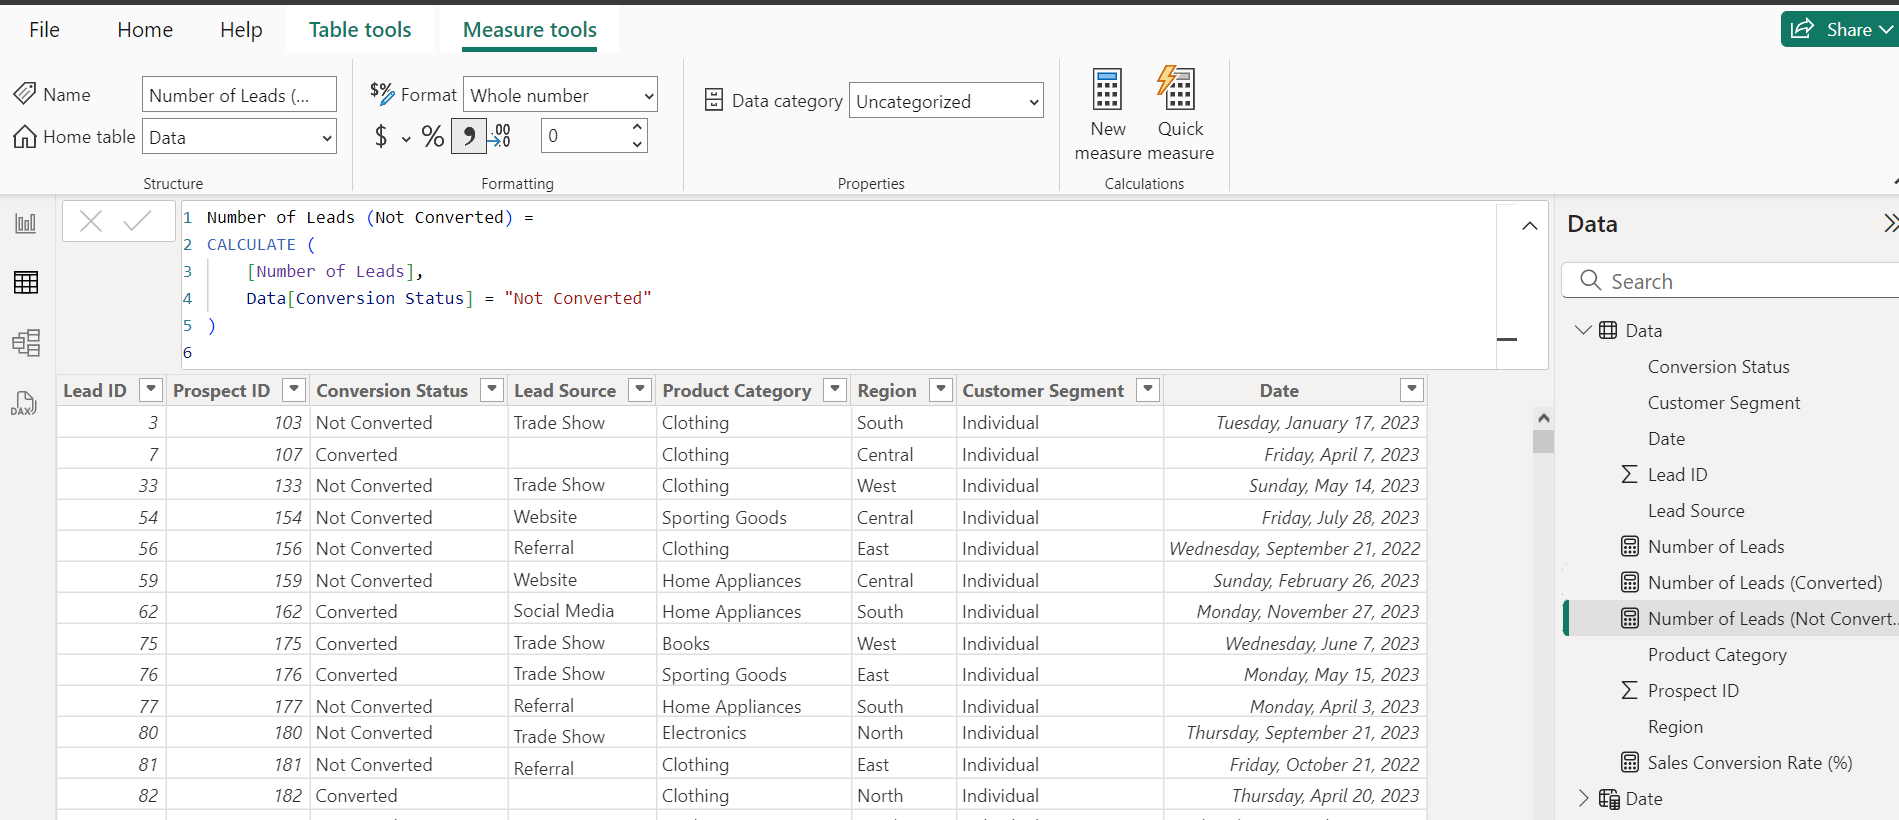
3. Data Analysis
4. Data Visualization
5. Insights & Key-Learnings
1. Data Collection
2. Data Modelling
3. Data Analysis
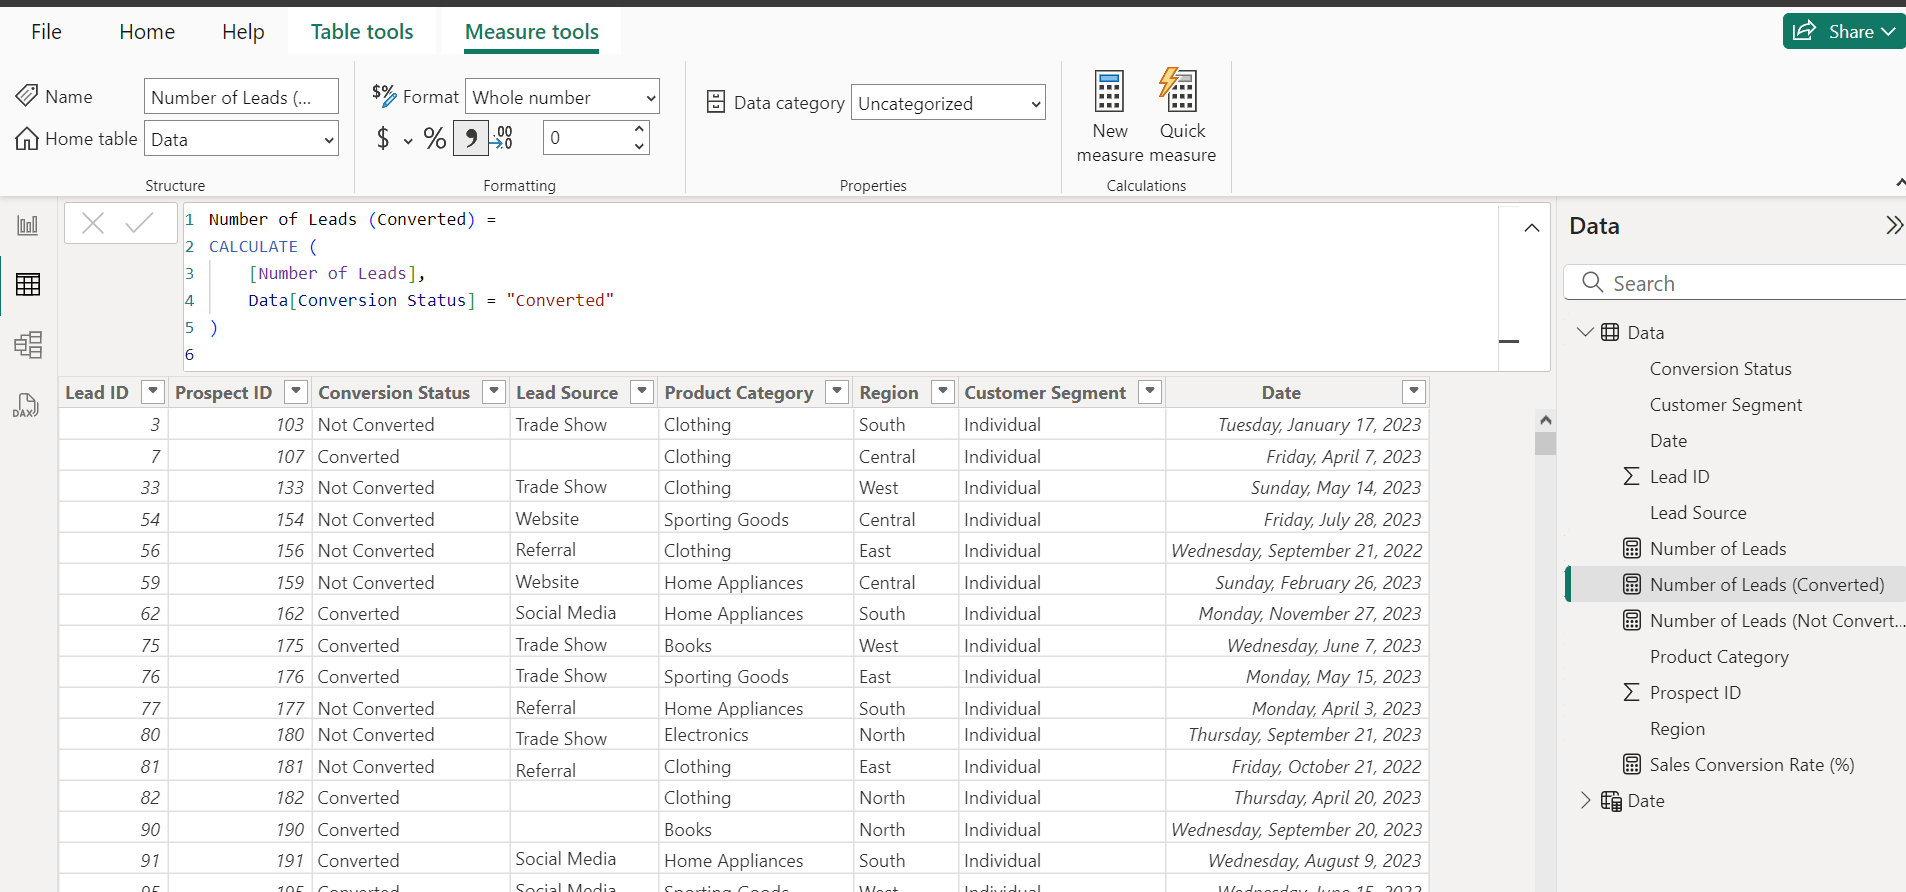
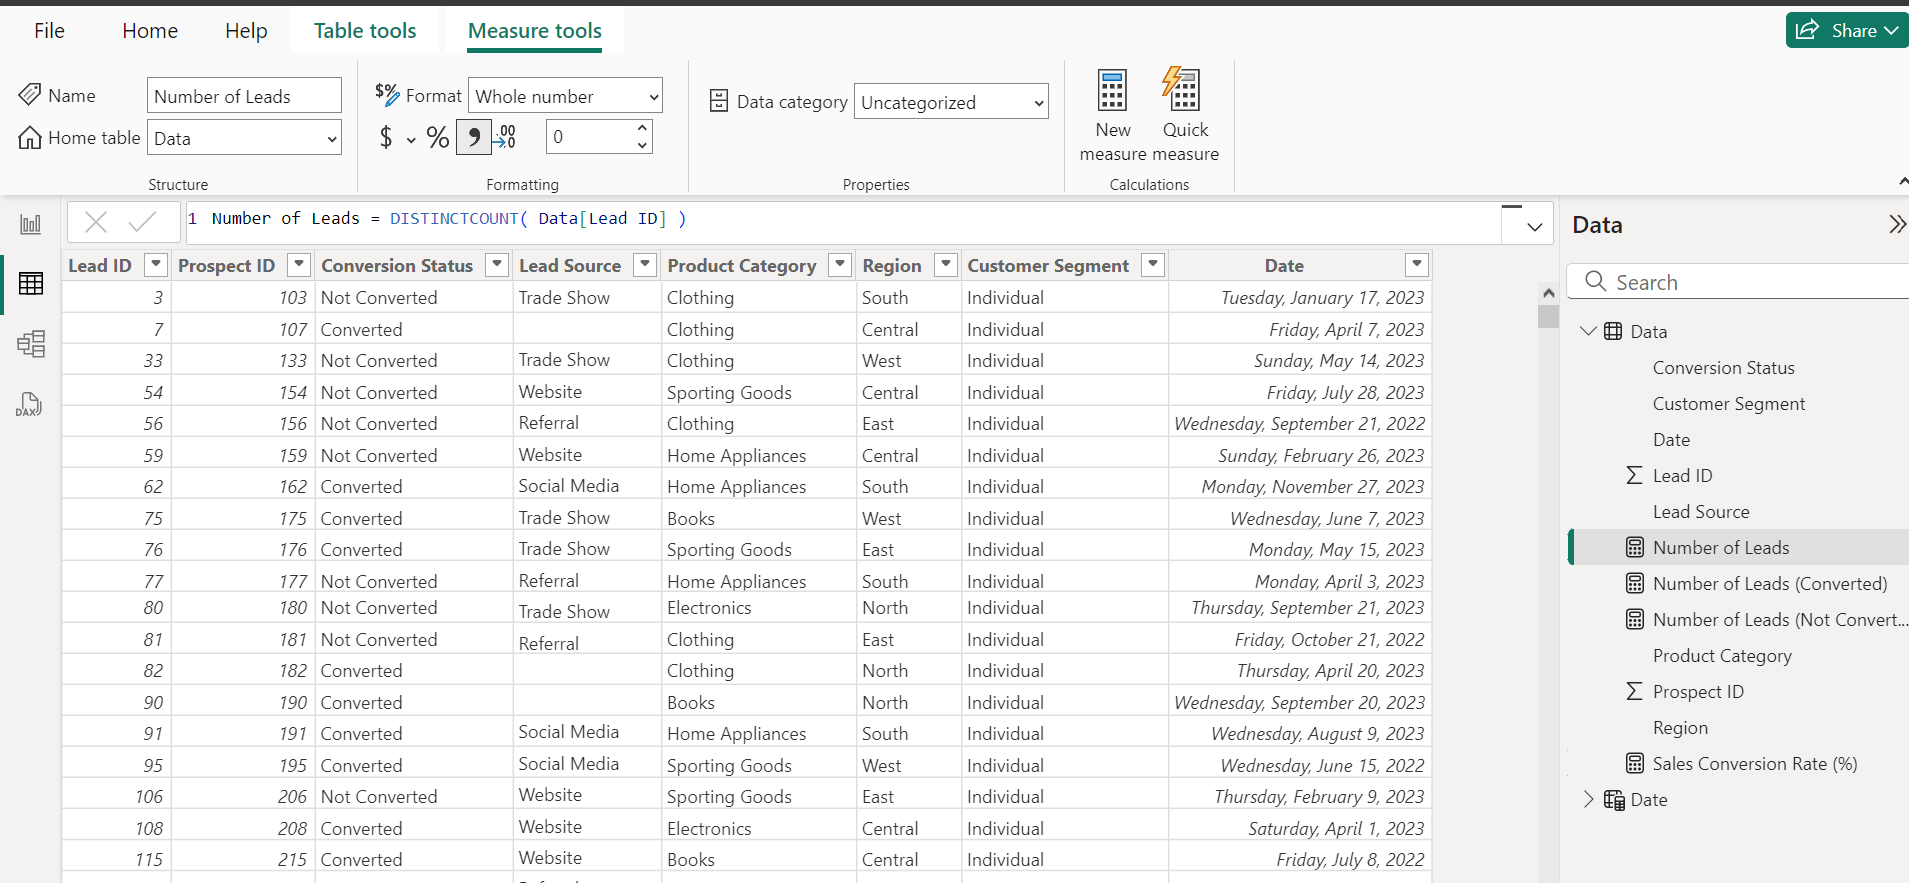
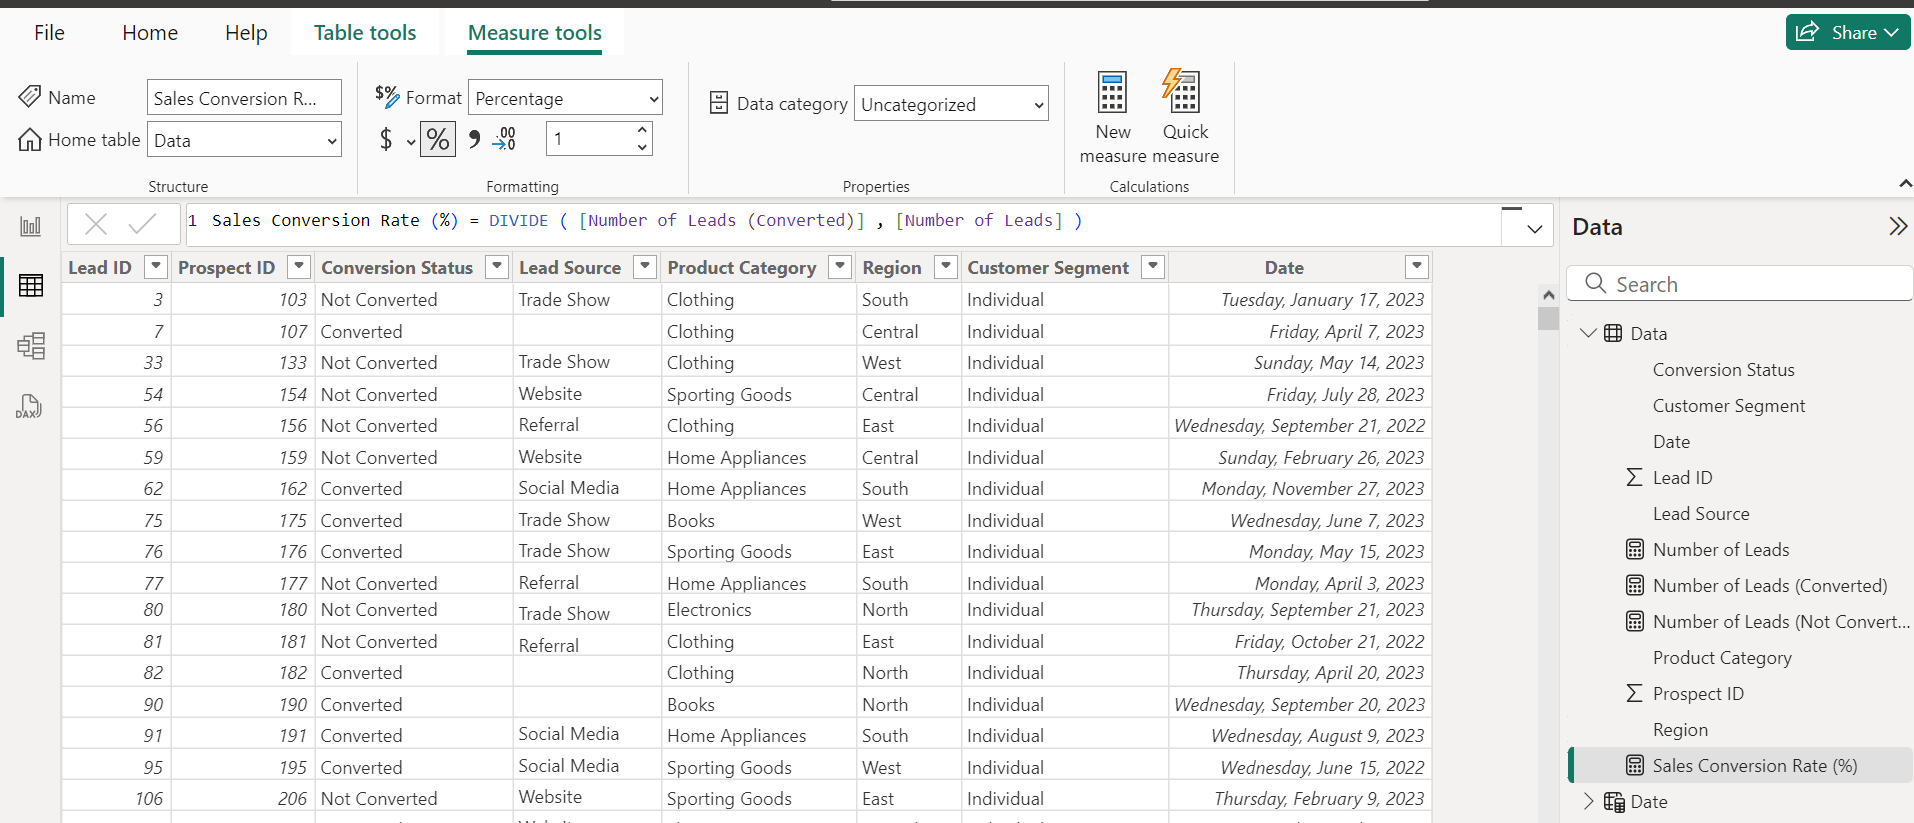
4. Data Visualisation
5. Insights & Key-Learnings
Key Insights:Overall Sales Conversion Rate:The overall sales conversion rate is 48.2%, indicating that nearly half of the leads are successfully converted into sales.Sales Conversion by Product Category:Insight: Clothing has the highest conversion rate, while Sporting Goods and Electronics have slightly lower conversion rates. Focus on maintaining high performance in Clothing and Home Appliances, and look for improvement opportunities in Sporting Goods and Electronics.Sales Conversion by Customer Segment:Insight: The Wholesale and Enterprise segments have the highest conversion rates. Efforts to increase engagement and tailored offerings to Small Businesses and Individuals could help improve their conversion rates.Sales Conversion by Region:Insight: The South and West regions have the highest conversion rates. Investigating what strategies are effective in these regions could help replicate success in lower-performing regions like the East and North.Monthly Sales Conversion Trends:Highest Conversions: June (27), July (26)Lowest Conversions: August (13), November (12)Insight: There is a significant drop in conversions during August and November. Analyzing potential causes such as seasonality, marketing efforts, or economic factors during these months could help address the low performance.Recommendations:1. Enhance Underperforming Segments and Categories:Sporting Goods: Evaluate the marketing and sales strategies for this category. Consider customer feedback to understand barriers to conversion.Small Business Segment: Tailor marketing campaigns and offers specifically to small businesses to boost their conversion rates.2.Replicate Successful Strategies:Clothing and Home Appliances: Identify and document successful strategies used for these categories. Apply similar tactics to lower-performing categories.Wholesale and Enterprise Segments: Investigate the reasons behind their high conversion rates and replicate these successful approaches across other segments.3.Regional Focus:East and North Regions: Investigate challenges specific to these regions. Consider regional promotions or targeted campaigns to improve conversions.South and West Regions: Maintain and optimize the strategies that are working well in these regions.4.Monthly Trends Analysis:August and November: Conduct a detailed analysis to understand why conversions drop during these months. Implement targeted campaigns or promotions to mitigate this drop.Continuous Monitoring: Track monthly conversion rates to identify trends and seasonality. Adjust marketing strategies based on these insights to optimize conversion rates throughout the year.5.Customer Feedback and Engagement:Collect and analyze customer feedback regularly to understand the reasons behind conversions and non-conversions. Use this feedback to improve products, services, and marketing strategies.Enhance follow-up processes with potential leads, ensuring timely and personalized engagement.6.Data-Driven Decision Making:Utilize the insights from this analysis to inform strategic decisions, allocate resources effectively, and prioritize efforts on high-potential areas.Continuously monitor key metrics and adjust strategies based on real-time data to maintain and improve conversion rates.By implementing these recommendations and leveraging the insights derived from the analysis, the business can optimize its sales conversion processes, improve customer engagement, and ultimately drive higher sales and revenue.