Repeat Customer Rate Analysis
Business Request & User Stories
MAIL FROM STAKEHOLDER
Subject: Diving into Customer Loyalty Insights?
Dear Awesome Data Analyst,
I trust you’re keeping well.
As we march forward with our ambitious growth plans, I’ve been reflecting on our existing customer base. We’ve always believed that the backbone of our business success isn’t just about attracting new customers, but ensuring those who’ve made a purchase with us once, choose to do so again.
I’ve been hearing anecdotes from our sales and support teams about customers who keep coming back, but I’d like a more systematic understanding. Are there particular months or seasons where we see a spike in returning customers? What portion of our monthly sales can be attributed to those who’ve shopped with us before?
For our upcoming strategy huddle, getting a clearer picture of these recurring engagements could be invaluable. It might help us in tweaking our engagement strategies and optimizing our campaigns to further incentivize repeat business.
If you could delve into this and provide some visual insights, it would greatly aid our discussions. Your knack for translating raw numbers into meaningful insights never ceases to amaze!
Warm regards,
Charlie Thompson
Director of Customer Engagement
USER STORIES
1.Monthly Trends of Repeat Customers: As the Director of Customer Engagement, I want to analyze the monthly trends of repeat customers to understand loyalty over time.
2.Seasonal Spikes in Repeat Business: As the Director of Customer Engagement, I want to pinpoint any months or seasons with notable increases in repeat customers to assess possible seasonal influences.
3.Sales Attribution to Repeat Customers: As the Director of Customer Engagement, I want to know the percentage of monthly sales attributed to repeat buyers to measure the impact of customer loyalty on revenue.
4.Correlation Between Campaigns and Repeat Business: As the Director of Customer Engagement, I want to evaluate the effect of specific campaigns or promotions on boosting repeat customer rates.
5.Visualize Repeat Customer Patterns: As the Director of Customer Engagement, I want a visual representation of repeat customer trends to discuss and share during strategy sessions.
SELECTED KPI
Repeat Customer Rate: Calculates the Percentage of Customers Who Have Made More Than One Purchase Over a Given Time Frame.
Example: Out of 1,000 customers who made a purchase in July, 300 had previously bought something from our store earlier in the year. This results in a repeat customer rate of 30%.
Application: Assessing the repeat customer rate is vital for understanding customer loyalty and the effectiveness of retention strategies. A higher rate can indicate customer satisfaction and the appeal of the products or services offered. On the other hand, a lower rate may signal potential areas of improvement in product quality, customer service, or overall shopping experience. This metric aids businesses in fine-tuning their approaches to enhance customer loyalty, thereby potentially increasing lifetime customer value and revenue.
Objectives1. Understand Repeat Customer Behavior:Identify trends in repeat customer purchases.Determine periods (months or seasons) with a spike in returning customers.Quantify the contribution of repeat customers to monthly sales.2.Optimize Engagement Strategies:Analyze the impact of marketing campaigns on repeat purchases.Evaluate the effectiveness of different order channels and payment methods in encouraging repeat business.3.Strategic Planning:Provide insights for strategy meetings to refine customer engagement tactics.Identify areas for improvement to enhance repeat customer rates.Key Metrics1.Repeat Customer Rate:The percentage of customers who make more than one purchase within a specific period.2.Monthly Repeat Customer Rate:Track repeat customer rates month-over-month to identify seasonal trends.3.Contribution to Monthly Sales:The portion of total sales attributed to repeat customers each month.4.Order Frequency:Average number of orders placed by repeat customers over a specific period.5.Marketing Campaign Effectiveness:Measure the success of marketing campaigns in driving repeat purchases.6.Channel Performance:Assess the performance of different order channels (online, in-store, etc.) in generating repeat business.7.Payment Method Analysis:Evaluate which payment methods are most commonly used by repeat customers.
The project workflow is explained below;
1. Data Collection
2. Data Modelling
3. Data Analysis
4. Data Visualization
5. Insights & Key-Learnings
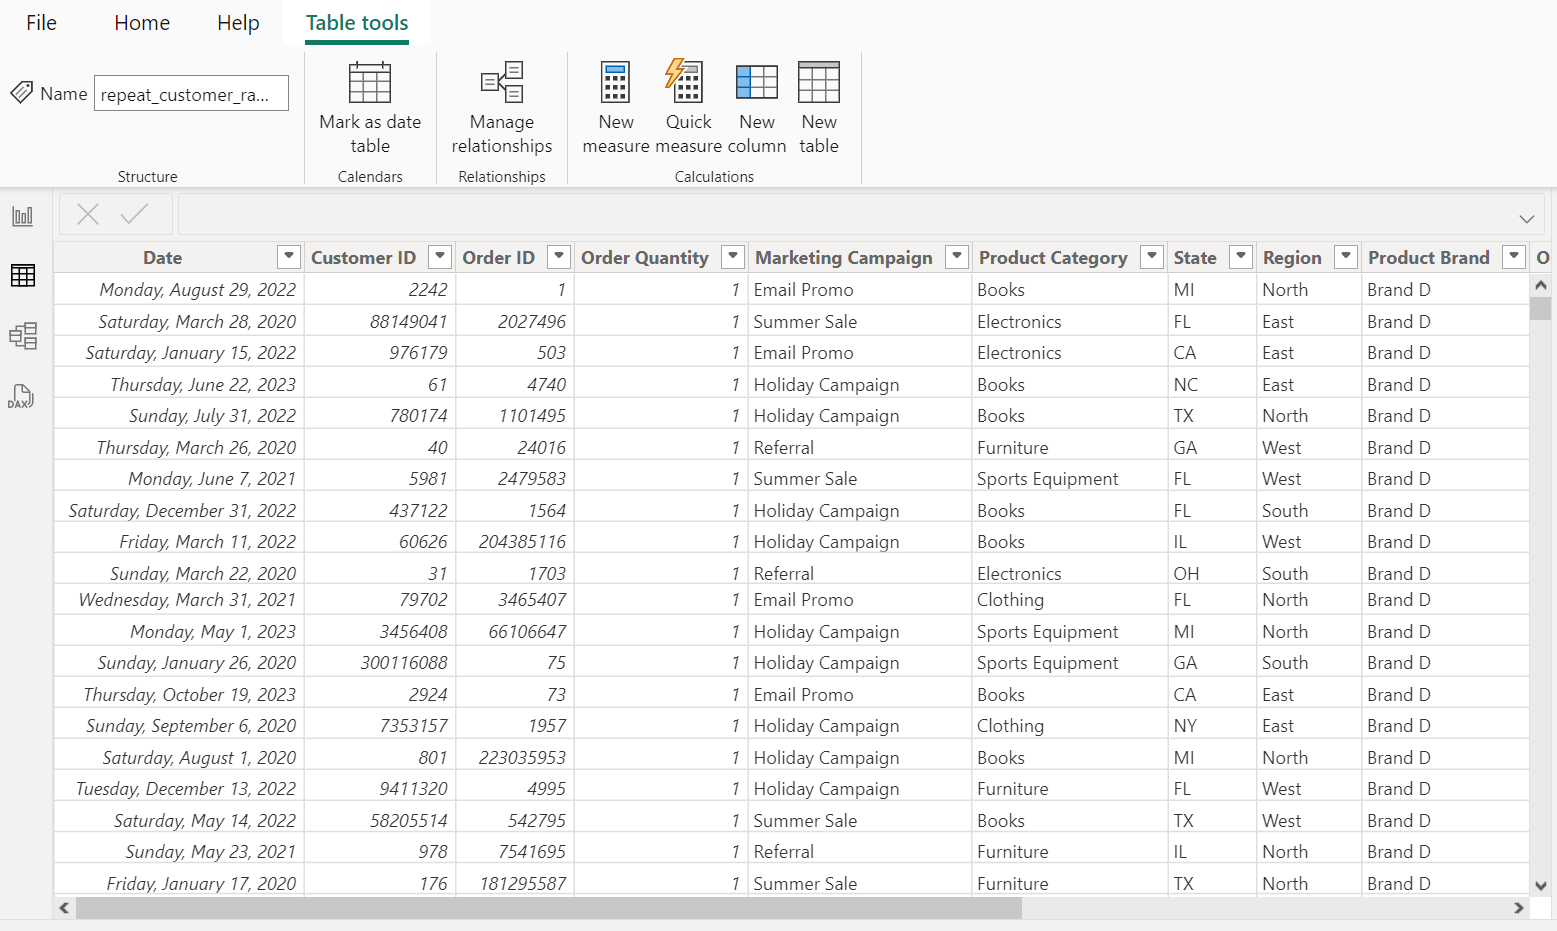
1. Data Collection
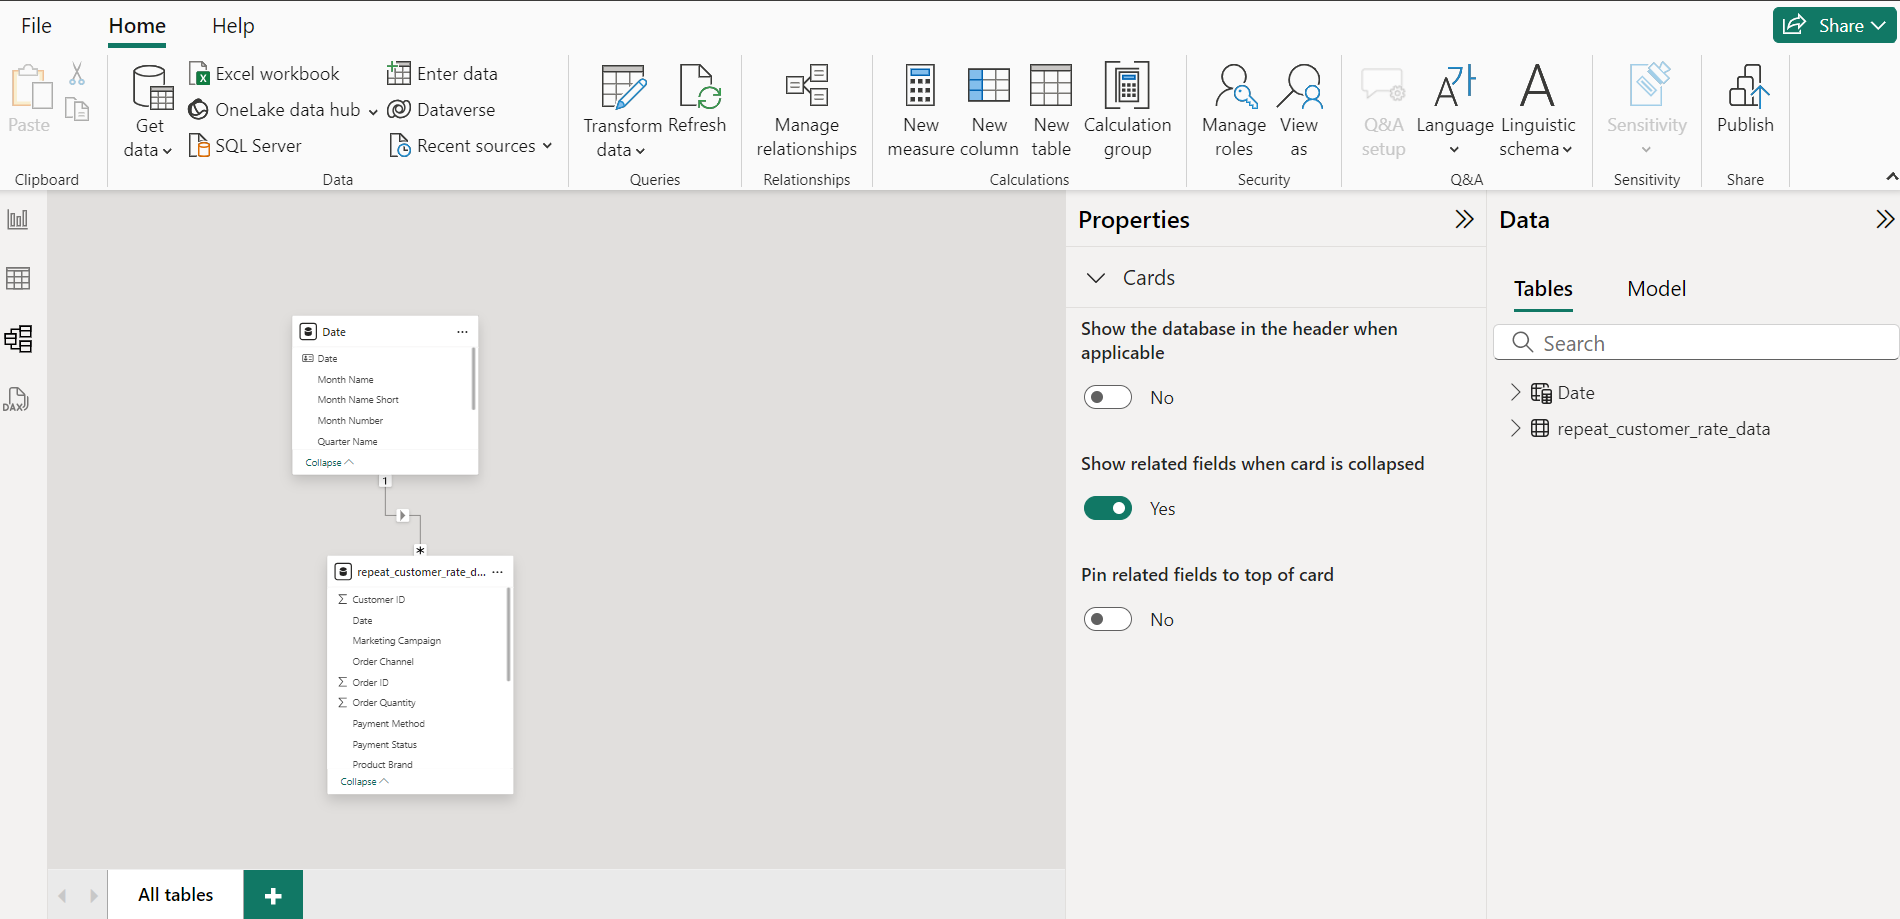
2. Data Modelling
3. Data Analysis
Month
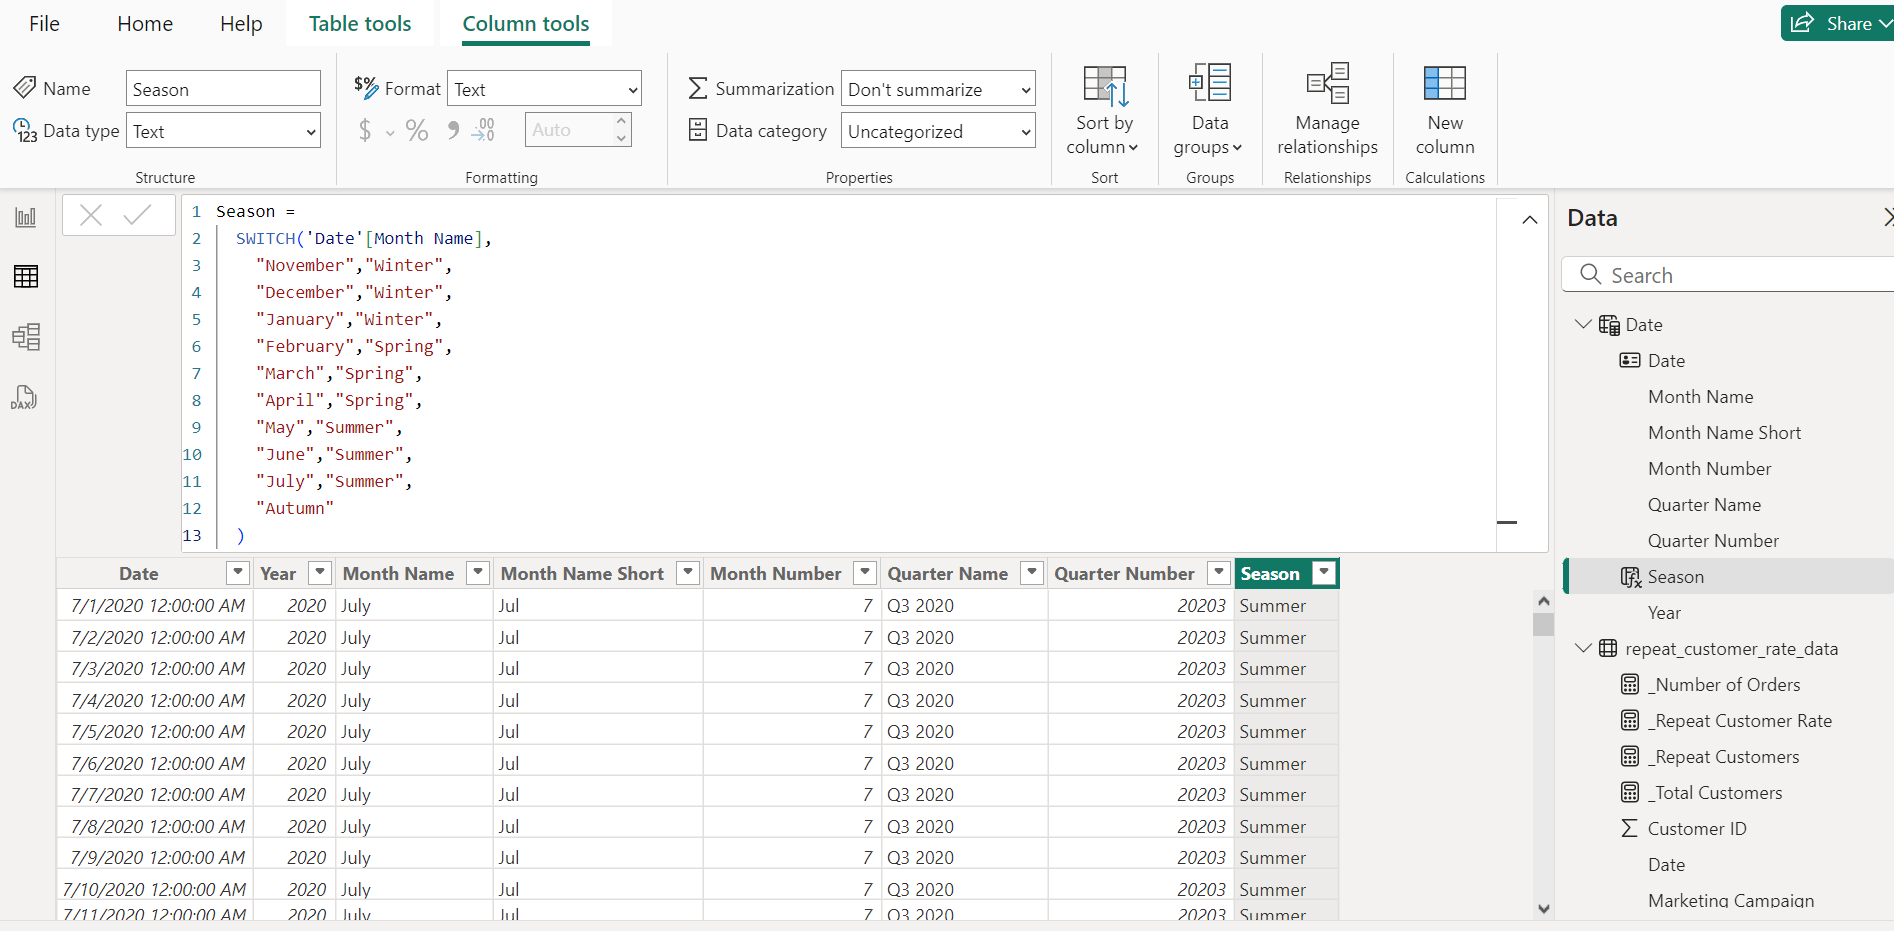
Year

Number of Orders
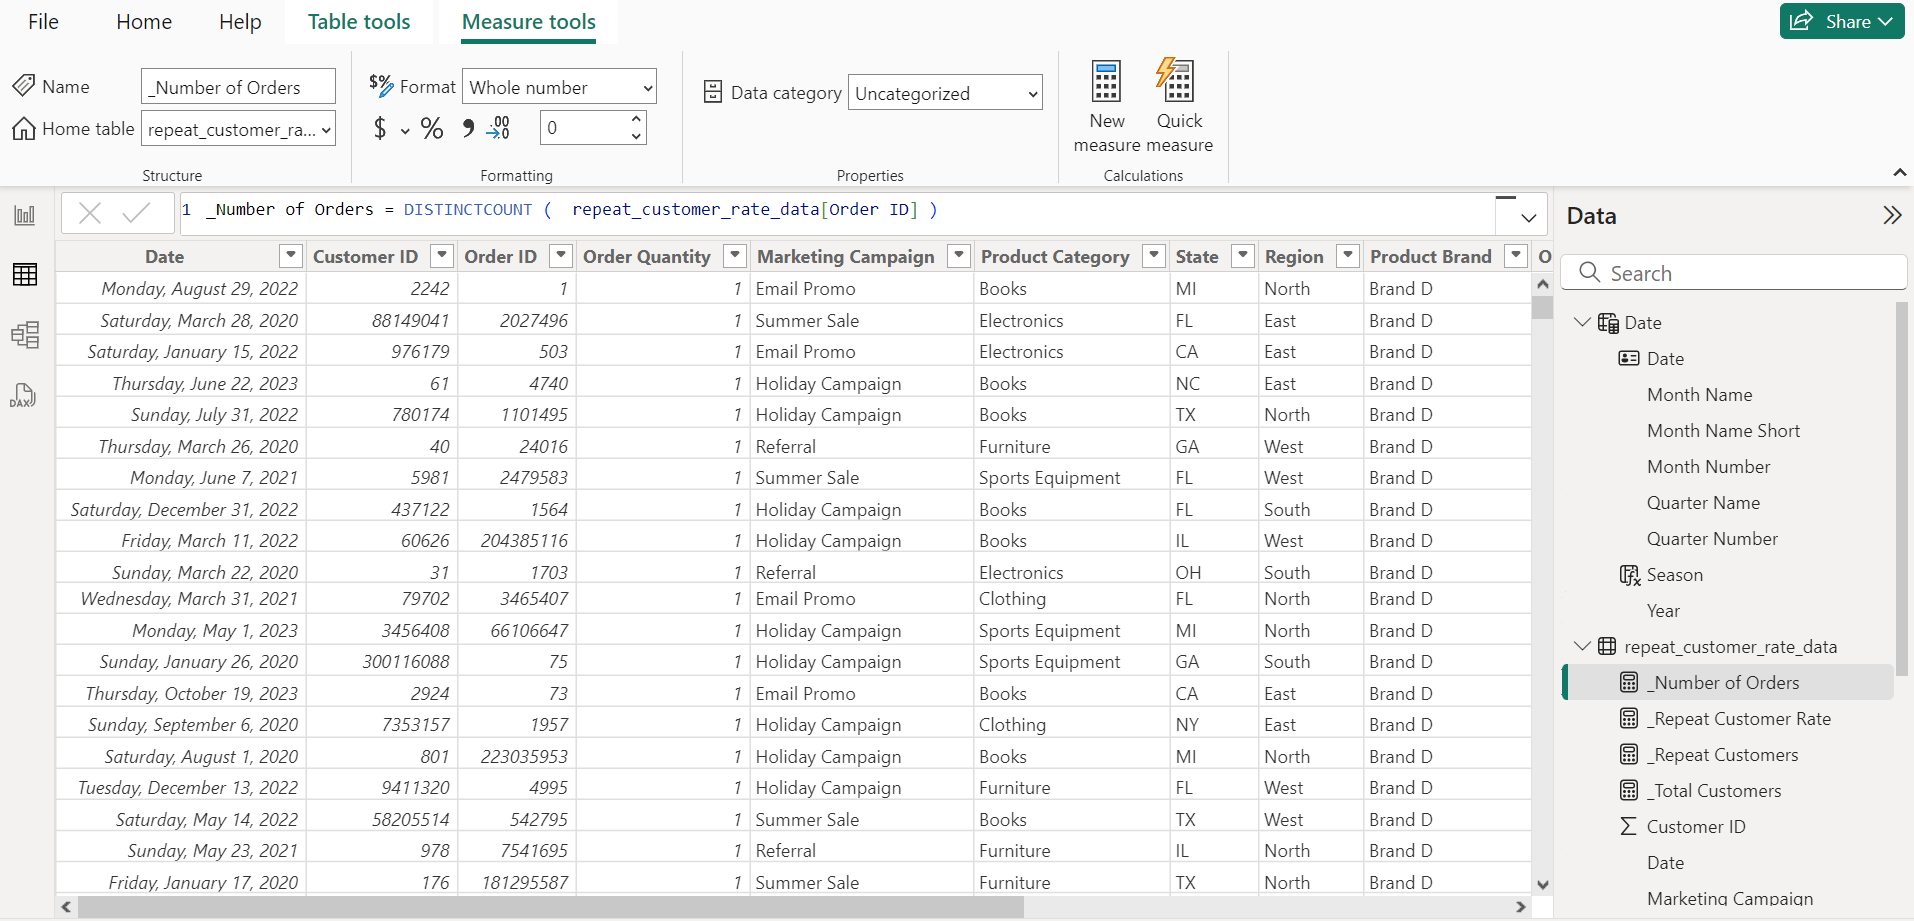
Repeat Customers
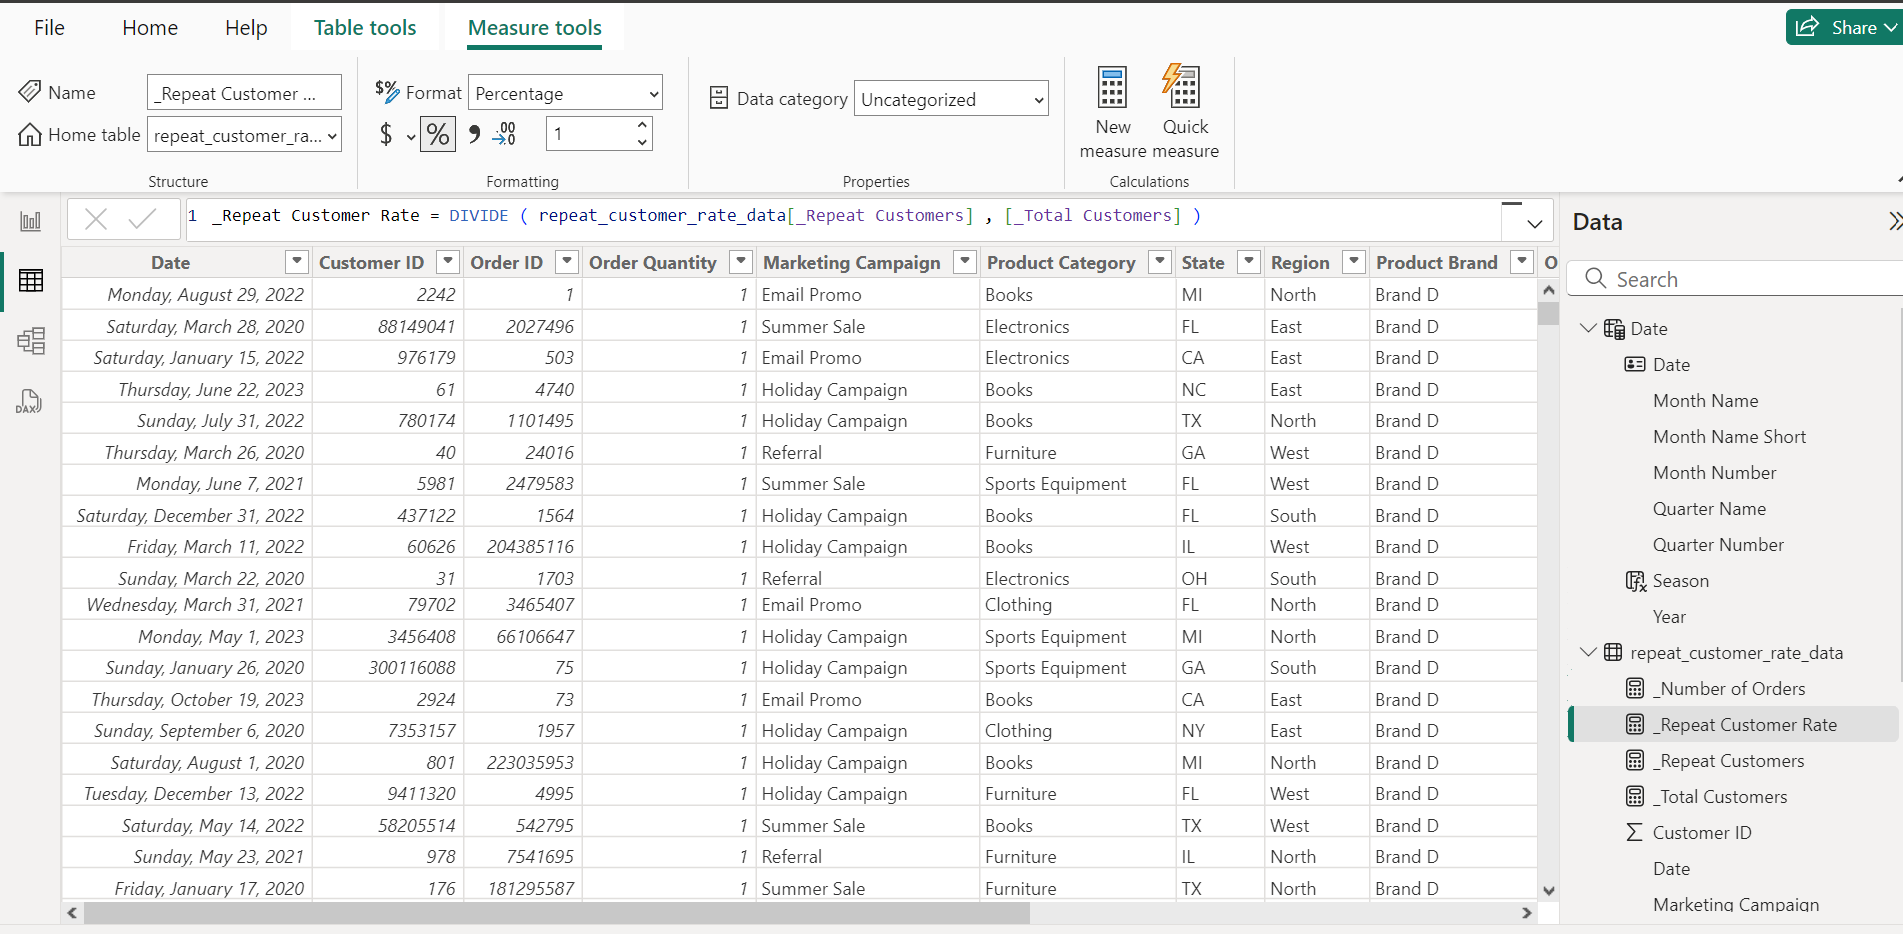
Total Customers
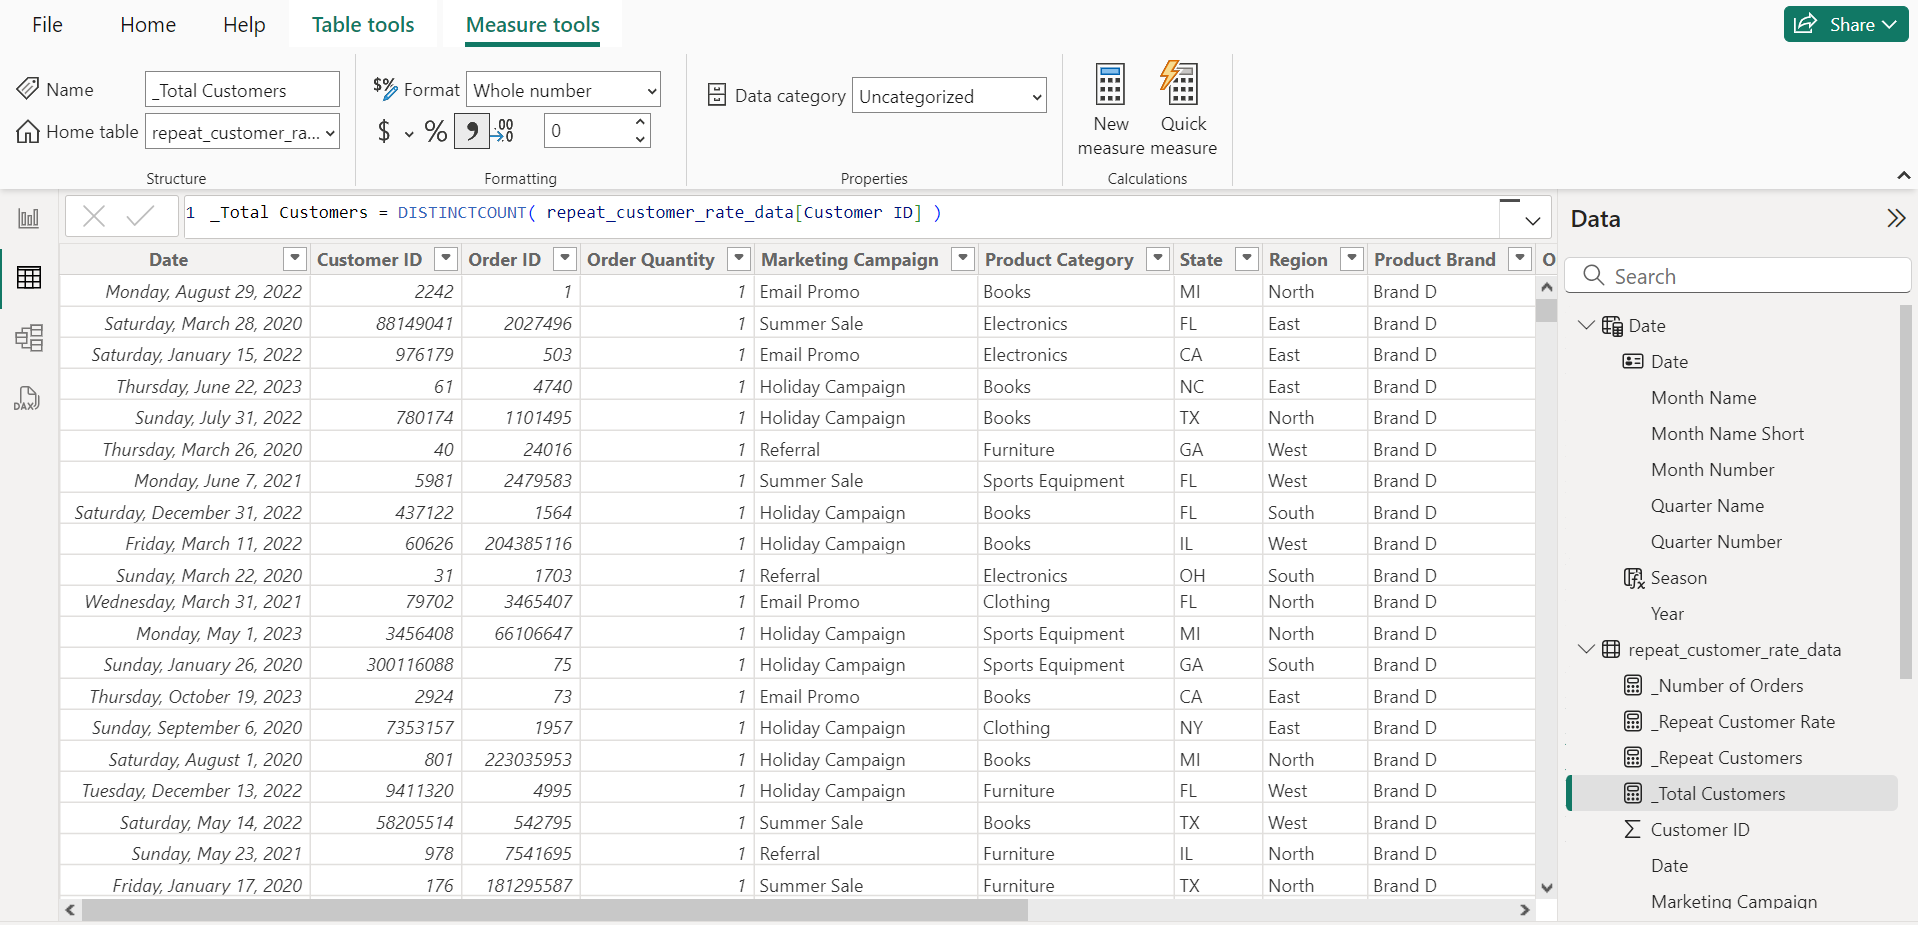
4. Data Visualisation
5. Insights & Key-Learnings
InsightsOverall Repeat Customer Rate:The overall repeat customer rate for 2023 is 28.8%. This indicates that nearly 29% of your customers are returning to make additional purchases.Seasonal Trends:Insight: Summer has the highest repeat customer rate at 30.6%, suggesting that customers are more likely to return during this season. Spring has the lowest repeat rate at 27.9%.Regional Distribution:Insight: The South region has the highest number of orders at 26.21%, while the West has the lowest at 23.6%. This suggests regional variations in customer behavior and engagement.Monthly Trends:High Months: January (35.7%), May (34.2%), April (32.6%)Low Months: March (22.4%), November (23.8%), October (24.5%)Insight: January has the highest repeat customer rate at 35.7%, while March has the lowest at 22.4%. This indicates that the beginning of the year and spring months see higher repeat purchases.Marketing Campaign Effectiveness:Insight: Referral campaigns are the most effective, yielding the highest repeat rate at 33.1%. Email promotions are the least effective with a repeat rate of 23.3%.Recommendations1.Enhance Seasonal Marketing Efforts:Summer Focus: Given the highest repeat rate in summer, increase marketing efforts and promotions during this season to maximize repeat purchases.Spring Boost: Since Spring has the lowest repeat rate, consider introducing special promotions or engagement strategies to improve customer retention during this period.2.Regional Strategies:South Region: Continue leveraging successful strategies in the South region and consider replicating these in other regions to boost overall repeat rates.West Region: Investigate why the West region has the lowest repeat rate and develop targeted campaigns to improve customer loyalty in this area.3.Monthly Campaign Adjustments:High-Performing Months: Capitalize on high-performing months like January and May by running major campaigns and offering loyalty rewards to sustain high repeat rates.Low-Performing Months: Address low-performing months such as March and November with special incentives, discounts, or customer engagement activities to encourage repeat purchases.4. Optimize Marketing Campaigns:Referral Programs: Given their high effectiveness, invest more in referral programs. Encourage current customers to refer new ones by offering incentives.Email Campaigns: Since email promotions have the lowest repeat rate, review and enhance email content and targeting strategies. Consider personalized offers and engaging content to improve their effectiveness.Holiday and Seasonal Sales: Continue leveraging holiday campaigns and seasonal sales, but experiment with new offers and marketing tactics to increase their impact.5. Data-Driven Decisions:Use the insights from this analysis to continuously monitor and adjust marketing strategies. Implement A/B testing for campaigns to identify what resonates best with customers and drives repeat purchases.By focusing on these recommendations, you can enhance customer retention, optimize marketing strategies, and ultimately improve the repeat customer rate, driving sustained business growth.