Average Order Value Analysis
Business Request & User Stories
MAIL FROM STAKEHOLDER
Subject: Insights into Customer Spending Patterns?
Dear Awesome Data Analyst,
I hope this email finds you in good spirits.
Lately, I’ve been pondering our sales strategies and the results they’ve been yielding. Our sales figures have been decent, but I’m interested in understanding more about the depth of each customer’s transaction. Are they buying more from us over time? Are there particular months where each transaction seems to be bigger than usual?
For our next review, I’d love to get a perspective on how our customer spending habits have evolved. While the overall sales numbers give one side of the story, I’m curious about the nuances of each transaction. It might give us a hint about the effectiveness of our pricing strategies, new product lines, and perhaps the impact of our marketing campaigns.
Could you help shed some light on this with your analytical magic? A visual representation would be of immense value, especially if we can see trends over time. This could be a great base for our discussions in refining our upcoming marketing and sales initiatives.
Once again, I’m turning to you to make sense of the patterns hidden in our data.
Best regards,
Charlie Thompson
Head of Sales Strategy
Enter your text here…
USER STORIES
1.Analyze Monthly AOV Trends: As the Head of Sales Strategy, I want to track the monthly trends of Average Order Value to gauge customer spending behaviors over time.
2.Highlight Months with AOV Spikes: As the Head of Sales Strategy, I want to identify months with unusually high AOV to understand seasonal or promotional impacts.
3.Correlate AOV with Marketing Campaigns: As the Head of Sales Strategy, I want to compare AOV trends with marketing campaign timelines to assess their influence on spending.
4.Examine AOV Post Product Launches: As the Head of Sales Strategy, I want to evaluate the AOV in the months following new product launches to understand their immediate impact.
5.Visualize AOV Patterns: As the Head of Sales Strategy, I want a visual representation of AOV trends to easily present and discuss during strategy meetings.
SELECTED KPI
Average Order Value (AOV): Represents the Average Amount Spent by a Customer in a Single Purchase.
Example: In April, our online store had 100 transactions, and the total revenue from these transactions was $5,000. This gives an Average Order Value of $50.
Application: Monitoring the AOV provides insights into customer spending behaviors and the overall value derived from each transaction. It can guide pricing strategies, product bundling options, and promotional offers, aiming to increase the average spend per customer and drive revenue growth.
The project workflow is explained below;
1. Data Collection
2. Data Modelling
3. Data Analysis
4. Data Visualization
5. Insights & Key-Learnings
1. Data Collection
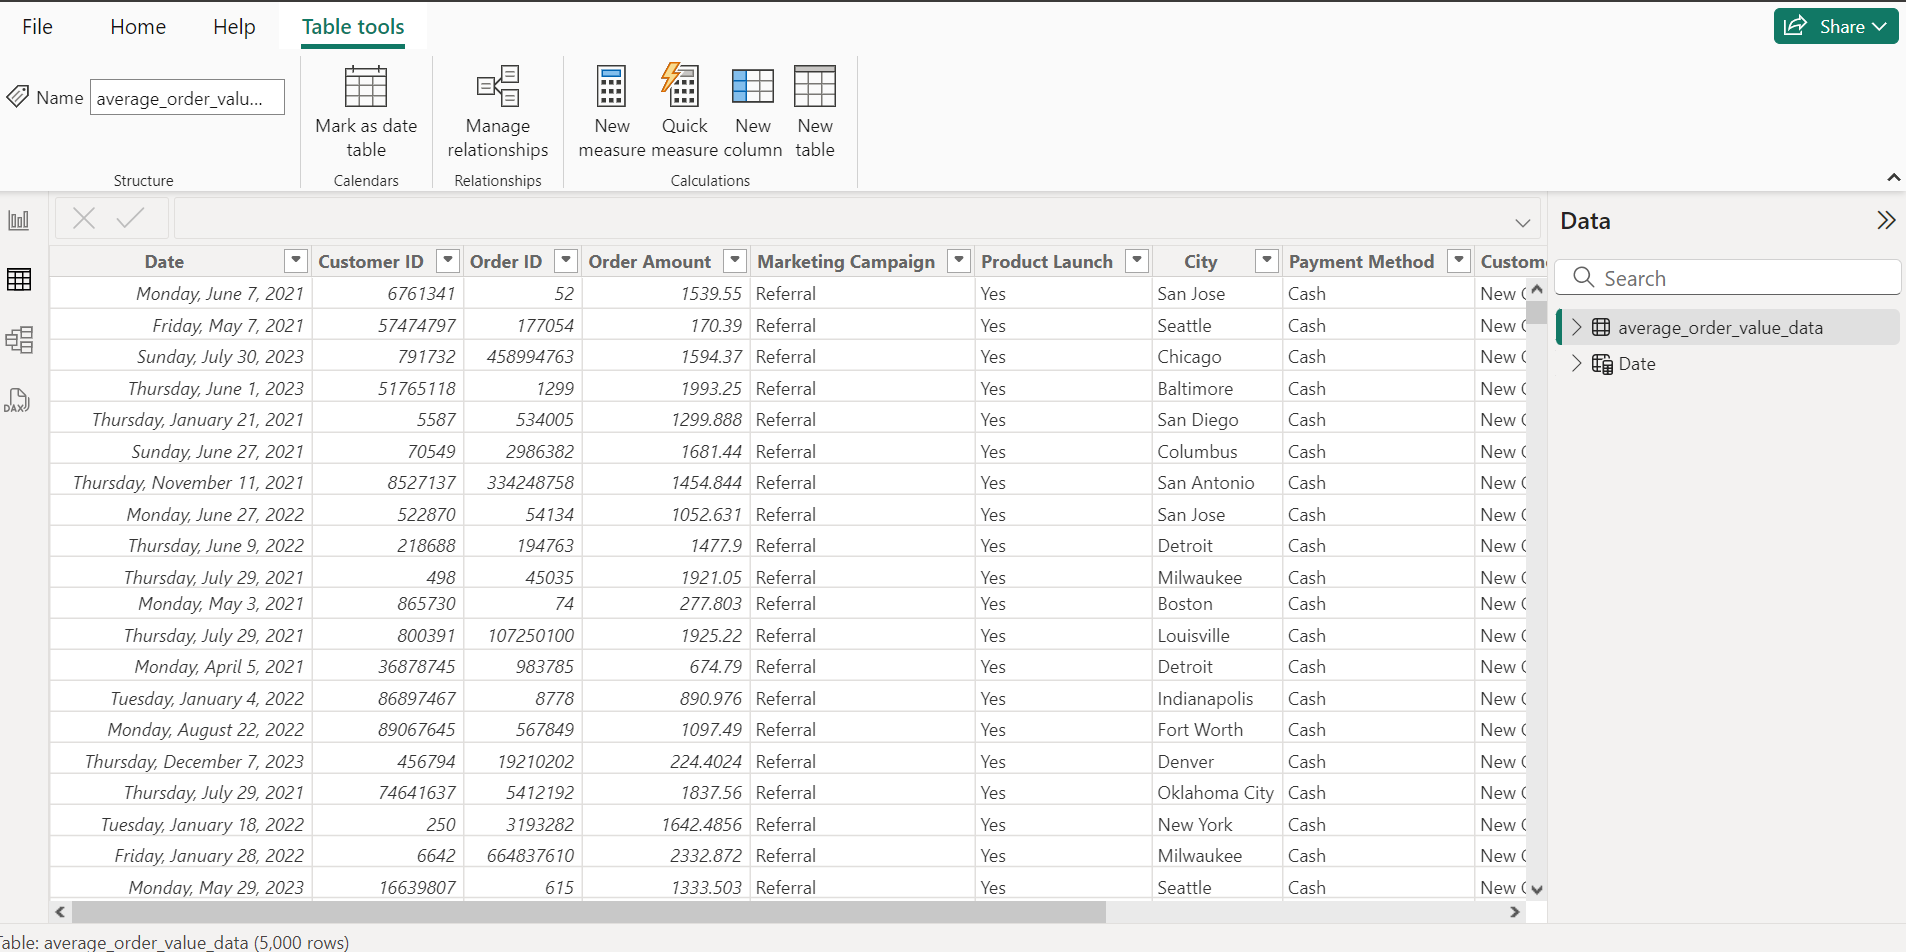
2. Data Modelling
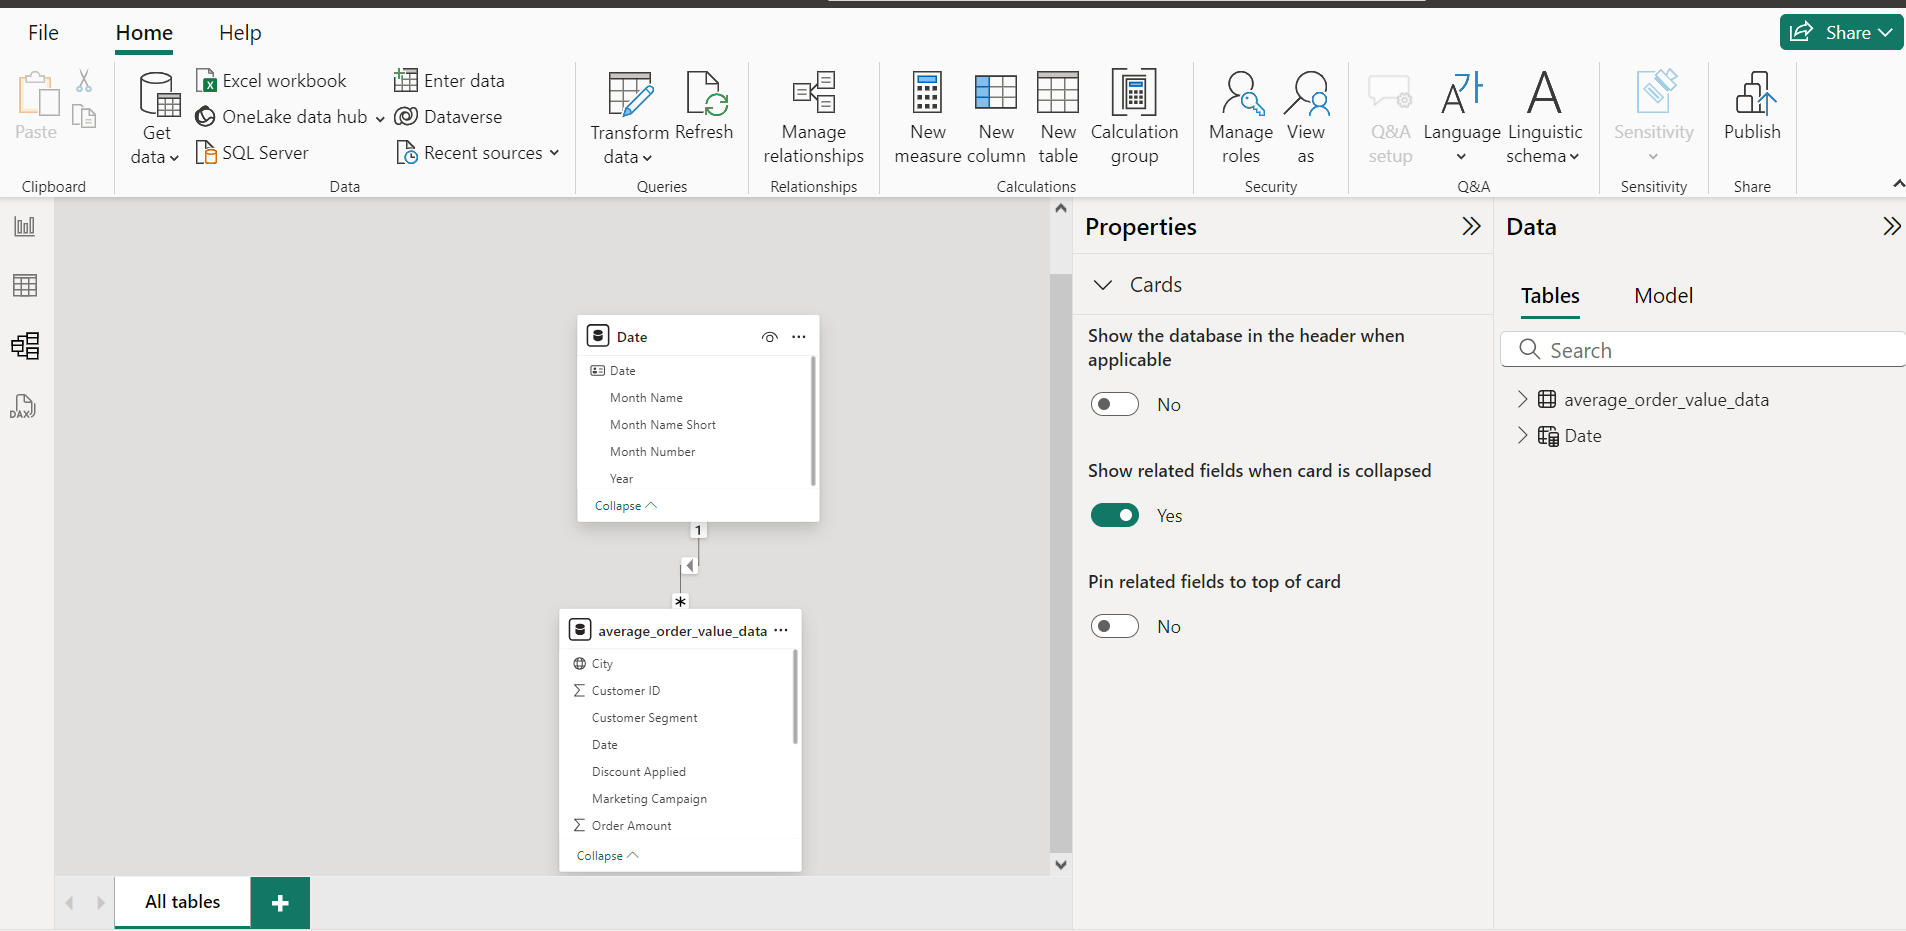
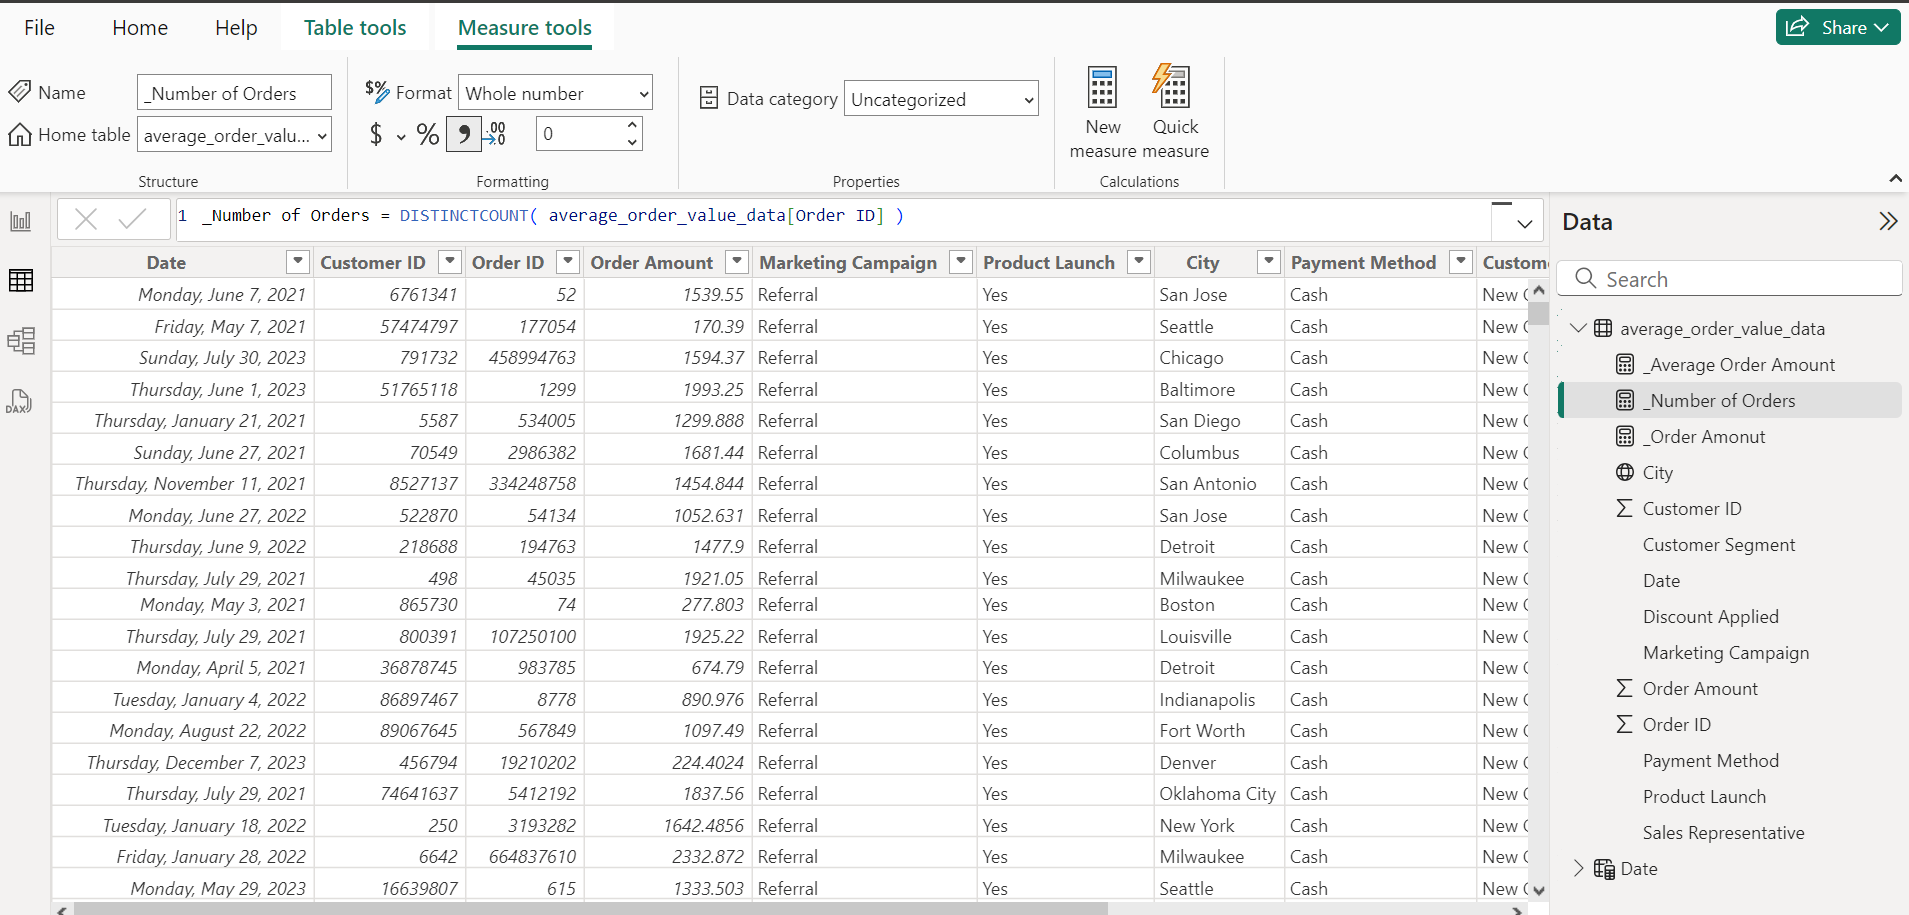
3. Data Analysis
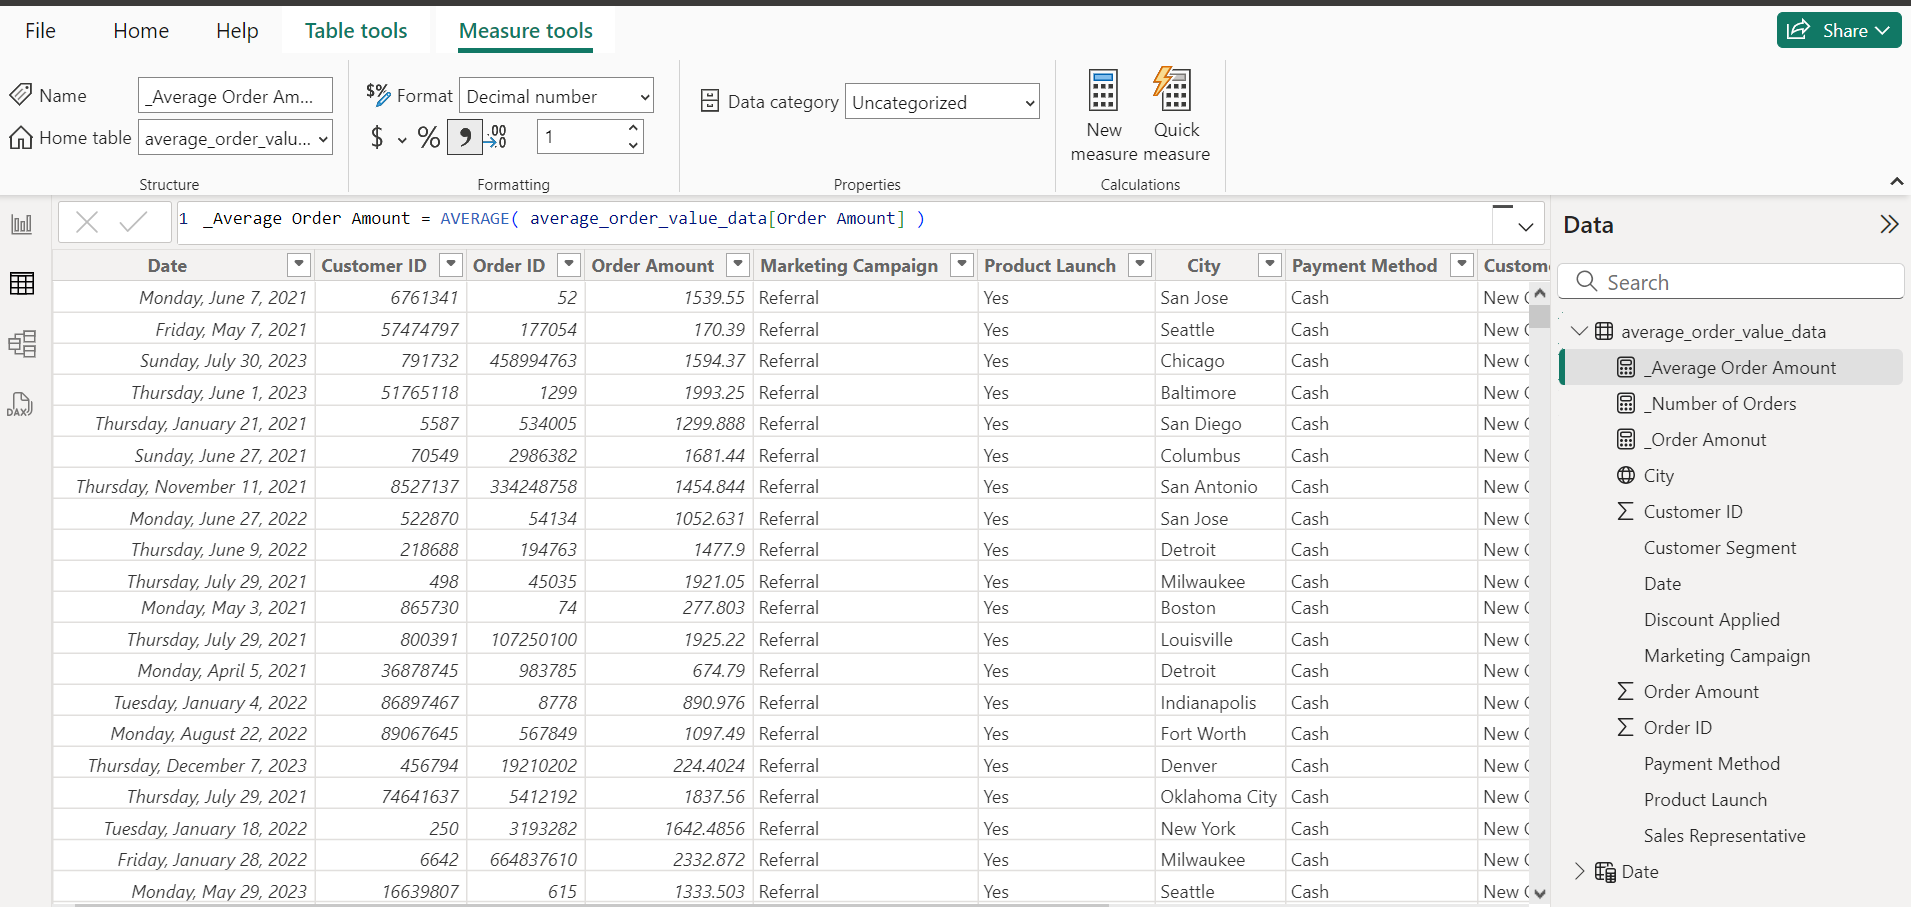
Average Order Amount
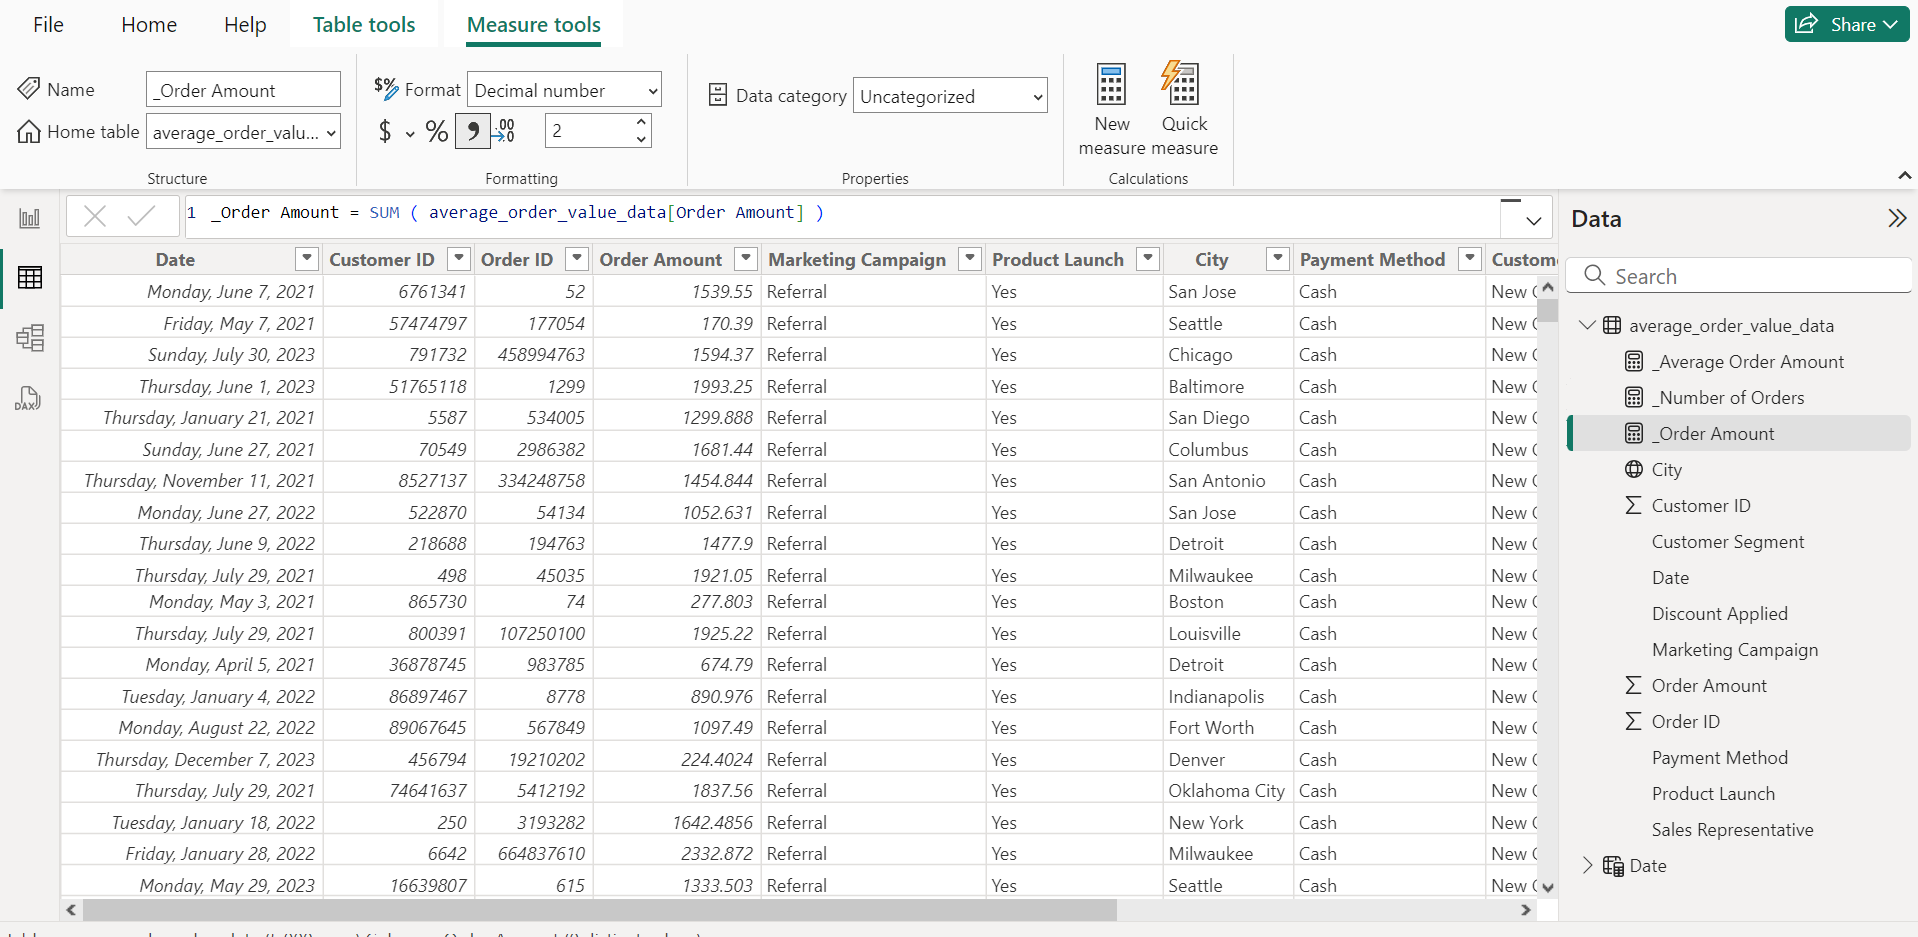
Order Amount
Number of Orders
4. Data Visualisation
5. Insights & Key-Learnings
Insights1. Overall Performance:Total Number of Orders: 1,273Total Order Amount: $1,331,800.14Average Order Amount: $1,046.202. Monthly Trends:Highest Average Order Amount: January ($1,256), followed by February and December ($1,223 each).Lowest Average Order Amount: April ($909).Insight: The beginning of the year (January and February) and December show higher average order values, possibly due to New Year and holiday promotions. April has the lowest average order value, suggesting it may need targeted promotions to boost sales.3. Order Amount by Month:Highest Order Amount: January ($147k) and December ($142k).Lowest Order Amount: April ($80k).Insight: Similar to the average order value trend, January and December have the highest total order amounts, indicating successful sales periods. April again shows the lowest total order amount.4. Effectiveness of Marketing Campaigns:E-mail Promo: Highest impact in February ($1,410), followed by January and December.Holiday Campaign: Highest impact in March ($1,120) and January ($1,185).Referrals: Highest impact in December ($1,297) and April ($1,166).Summer Sales: Highest impact in January ($1,534) and February ($1,412).Insight: Different campaigns peak at different times, with summer sales showing the highest average order values in January and February. Referrals perform particularly well in December, which may be influenced by end-of-year shopping.Recommendations1. Target Low-Performing Months:April Focus: Develop special promotions and marketing campaigns in April to boost the average order amount and total sales. Consider leveraging referral programs or new product launches.Summer Boost: Although the average order values are relatively high during summer sales, additional campaigns in June and July could further enhance performance.2. Leverage High-Performing Campaigns:E-mail Promotions: Continue and expand e-mail promotional efforts, particularly around January, February, and December, as they generate high average order values.Holiday Campaigns: Ensure robust holiday campaigns are in place, focusing on maximizing sales in March and December.Referrals: Given their success in December, encourage referral programs throughout the year, with heightened focus during high-traffic months.3. Seasonal Strategy:Peak Seasons: Amplify marketing efforts and inventory for January, February, and December, anticipating higher order values.Off-Peak Months: Introduce flash sales, limited-time offers, and personalized marketing during off-peak months like April and September to maintain steady sales and order values.4. Product-Specific Campaigns:Product Insights: Analyze product category performance in conjunction with marketing campaigns to identify which products drive higher average order values. Tailor campaigns to highlight these products during strategic periods.5. Customer Engagement:Retention Campaigns: Focus on customer retention strategies, especially through referrals and holiday campaigns, to maintain high repeat purchase rates.Personalized Offers: Use customer data to send personalized offers and recommendations, particularly through e-mail campaigns, to enhance order values.By implementing these recommendations, you can optimize your marketing strategies, improve monthly sales performance, and achieve a higher overall average order value, contributing to sustained business growth.